

Custom Tables let you define exactly what a table of your included studies should look like, i.e. which studies appear as rows, which bibliographic data, tags, and data elements appear as columns, and in what order instead of fixed export format. Use a Custom Table when you want to reproduce a spreadsheet structure of your own design, restrict output to a subset of studies, or control the level (study, study arm, or intervention) that each row represents.
Custom Tables draw on included studies only. For bulk exports covering all studies in your nest — metadata, screening decisions, tags, extracted data, critical appraisal, or full text PDFs — use Download from Inspector instead.
Where to Build a Custom Table #
The Table Builder is available in two places, and the build process is identical in both. The difference is what happens to the table once it’s built:
- Export page (under Synthesis, click Export): build a table for immediate download. You can also save the table for later retrieval, but it is not displayed anywhere. This is the best for one-time or internal exports.
- Dashboard Editor (Table Cards): build a table that lives in your Dashboard, updates as your nest changes, and is displayed on the shareable Synthesis page. It can be downloaded anytime directly from the Dashboard.
One functional difference exists between the two: the Export page offers an Advanced setting that, on download, places the columns under each root tag into a separate sheet of the workbook (see Advanced Settings below). The Dashboard Editor does not offer this option on download.
The rest of this page walks through the Table Builder on the Export page but note every step other than Advanced Settings applies equally to Table Cards in the Dashboard Editor.
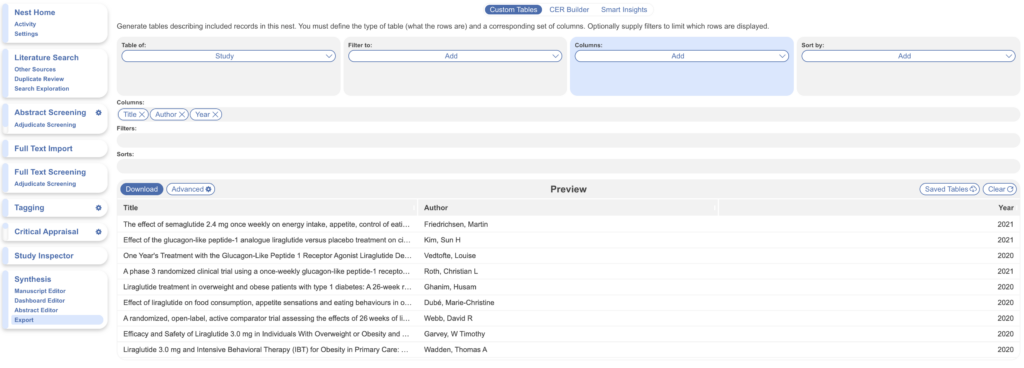
Throughout the build, the page presents a live Preview. Check it as you go as it shows the exact structure your table will have when exported.
1. Choose the Table Type #
The first decision is what each row of your table represents, because it determines every option that follows: which filters are available, and which columns you can add. Click the drop-down Table of: to choose.
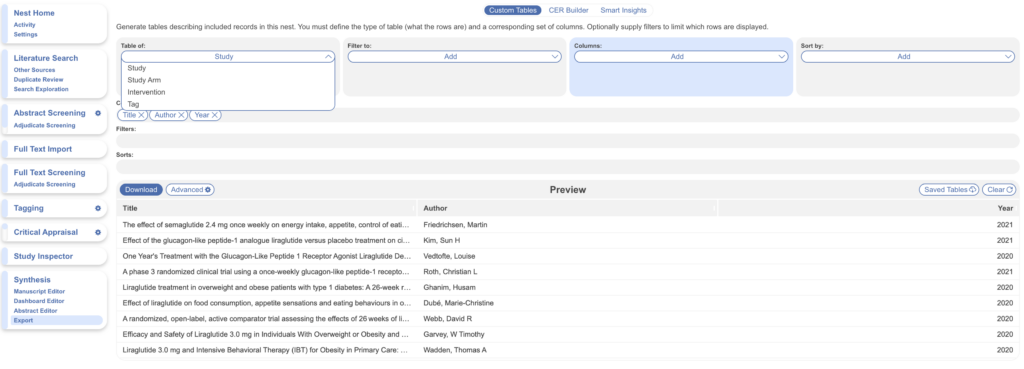
Study Table #
Selected by default, a Table of Studies displays one row per study, with any extracted data displayed as columns. This is the recommended type for most constructed tables. Columns can draw on bibliographic data, tag data, or study size, and studies can be sorted by bibliographic data, meta-analytical extracted data, or related report data.
Table of Study Arms #
One row per arm within each study (placebo, intervention groups, etc.), so a single study may span multiple rows. This requires completed Meta-Analytical Extraction, and it is the only table type that can list the exact data elements from the underlying studies making it the most common export type for statistical analysis. If MA Extraction is not configured, no rows will be shown. If you have an extracted tag table with study arms separated you wish to display, use a Table of Studies and add this table as a tag column.
Table of Interventions #
One row per Intervention, with columns limited to summaries of the Data Elements collected for each. This also requires completed MA Extraction, and is the closest table type to the Summary view of Quantitative Synthesis. If MA Extraction is not configured, no rows will be shown. If you have interventions defined as tags you wish to display, use a Table of Studies and add Interventions as a tag column.
Table of Tags #
A specialized option: rather than exporting study information, this exports your tag hierarchy itself. Each row is a tag, and you can include its Description; its Depth in the hierarchy (0 = Root Tag, 1 = directly below a Root Tag, and so on); whether it is configured as a Data Element; the frequency of the Exact Tag; and its Recursive Frequency (how often the tag or any of its children were applied).
Note: Study Arm and Intervention tables can only be generated if arms and interventions were assigned during Meta-Analytical Extraction; otherwise they will produce a blank table. If your data extraction was performed in Tagging only, use a Study table and select the relevant tags as columns.
2. Filter (Optional) #
By default, a Custom Table includes every included study in the nest. If you only want a subset, use the Filter To drop-down. The available filters depend on the table type:
- Study: bibliographic data (publication date and time of retrieval), applied tags, Full Text Status, related report family, and related report type.
- Study Arms: everything available for Study tables, plus arms with a specific Intervention and/or a specific Data Element collected.
- Interventions: studies with a specific Intervention.
- Tags: studies with a tag at or below a certain level.
3. Add Columns #
With the table type set and any filters applied, define the columns using the Columns drop-down. Depending on table type, you can select:
- Bibliographic Data: Citation, Title, Year, Publication Date, Author, Authors, DOI, PubMed ID, a link to the article, among others. Synthesis Link links each row to the study’s page in your interactive Synthesis view, where all extracted data, related reports, and (where made viewable) full texts can be examined so downloaded tables retain a clickable path back to the underlying evidence. To place all citation information in a single cell, select Citation — all references in Nested Knowledge follow JAMA format.
- Full Text Status: whether a full text has been imported for each study.
- Tag: tag names and tag text excerpts, at or below a given tag or for an exact tag (see Adding Tag Columns below).
- Arm Data
- Intervention: the Intervention applied to a cohort or Study Arm.
- Arm Size: the total number of patients in a Study or Arm (MA Extraction only for arms).
- Data Element: the exact quantitative data associated with a given Study Arm or cohort (MA Extraction only). Categorical Data Elements cannot be exported in this structure due to their column sizes.
- Tag MetaData (Table of Tags): name, description, depth, and data element type.
- Tag Statistics (Table of Tags): Exact and/or Recursive Frequency.
Adding Tag Columns #
A tag column can display more than just the tag name, and two independent settings control what appears in its cells:
- Contents — whether the cells display the annotation/excerpt text collected with the tag. Toggled on, cells show the tag’s contents; toggled off, cells show only the tag name where applied.
- Children — whether the column captures tags at or below the selected tag, or only the exact tag. Toggle this on when selecting a parent tag whose applied child tags you want listed in the cells; leave it off when selecting a specific child tag on its own.
You will encounter these settings in two places, and they are the same two settings each time:
When selecting the tag, Contents and Children as labelled toggles. Set them before adding the column.
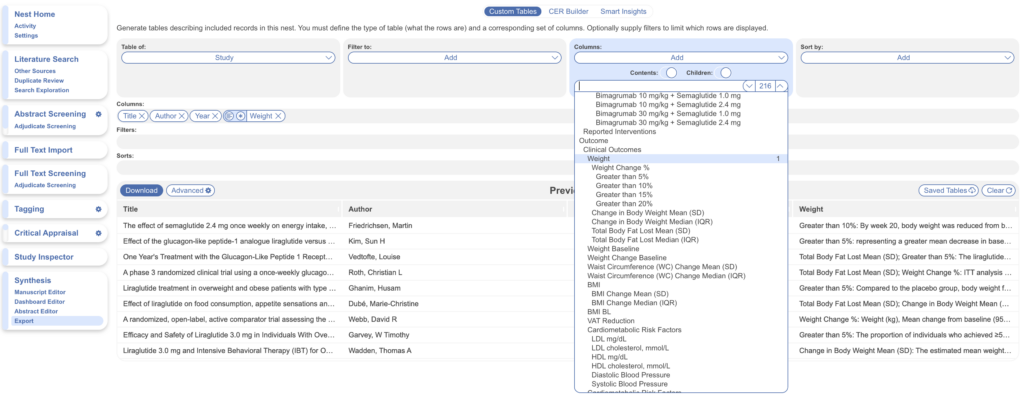
After the column is added, the labelled toggles are replaced by two small icons on the left side of the column pill: a lines icon for Contents and an asterisk icon for Children, in that order (in red below). Click either icon to toggle that setting on or off at any time — you do not need to remove and re-add the column to change its behaviour. A displayed icon means the setting is on.
In the below screenshot, the parent tag: Weight is added as a column with contents and children. This is displayed in the Preview.
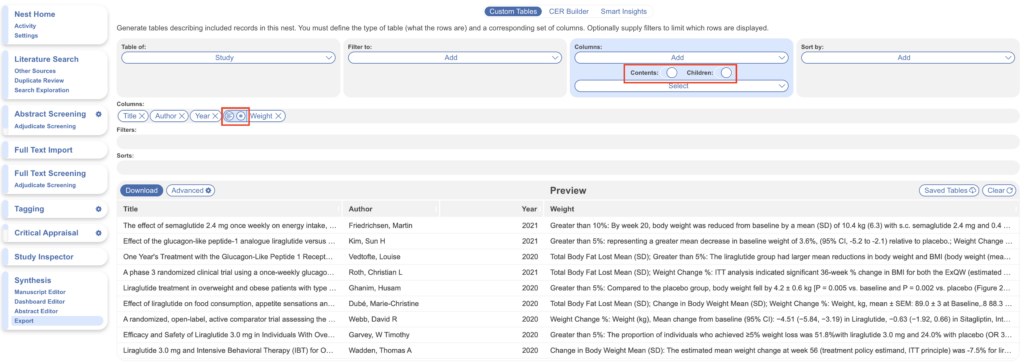
The four combinations, and when to use each:
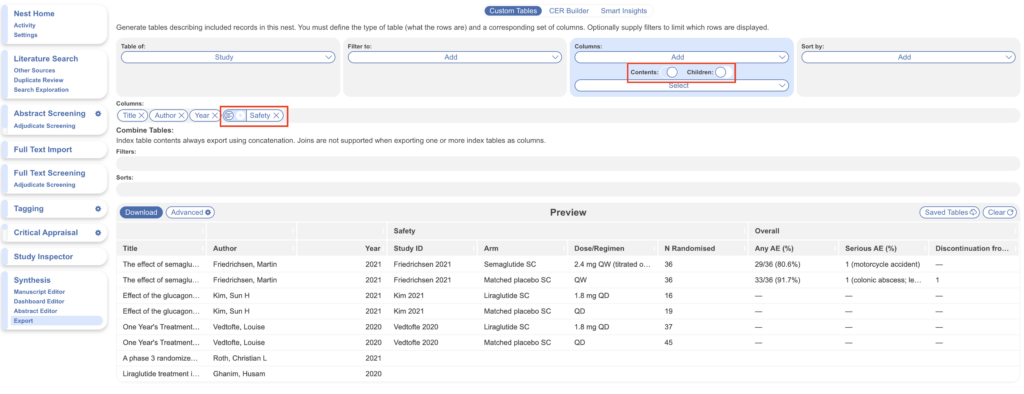
1. Contents on, Children off (the default)
Select a child tag; its name is the column header and its annotation/contents fill the cells. You typically would use this setting for child tags with table contents.
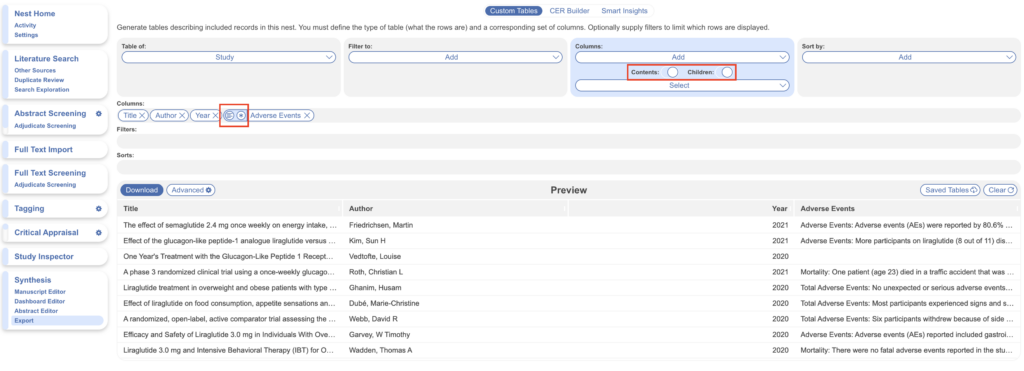
2. Contents on, Children on
Select a parent tag; its name is the column header, and the cells list every applied child tag together with its annotation/contents.
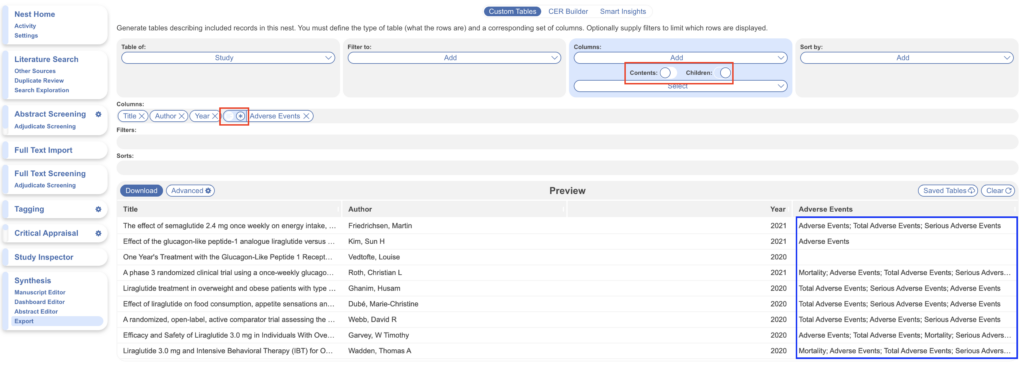
3. Contents off, Children on
Select a parent tag; its name is the column header and the cells list the applied child tags by name only, without contents. See below for preview.
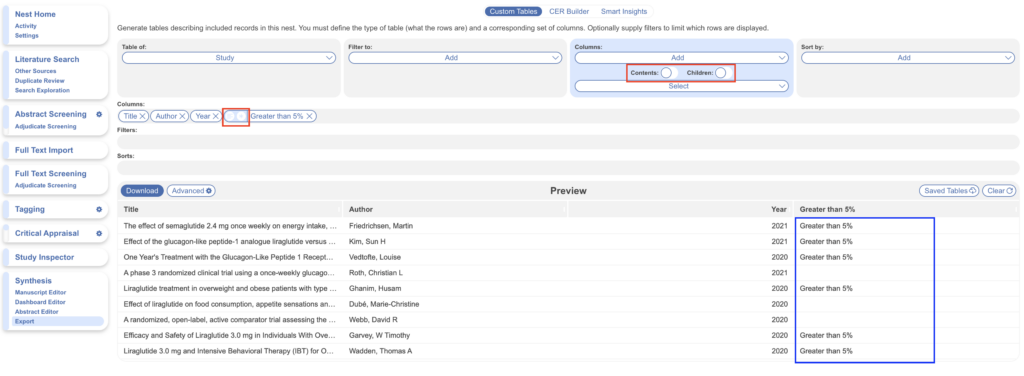
4. Contents off, Children off
Select a child tag; its name is the column header and the cells simply display the tag name where it was applied — useful as a yes/no indicator.
Combining Tag Table Columns #
If you have configured and extracted data in tag tables, you can add individual tags or entire table contents to your Custom Table. Under the columns drop-down, select Contents ON, Children OFF. Tags with an associated table display a table icon, and you can pick tags individually or select All Table Contents at the top.
When multiple tag tables are added, they can be combined in one of two ways:
Concatenation
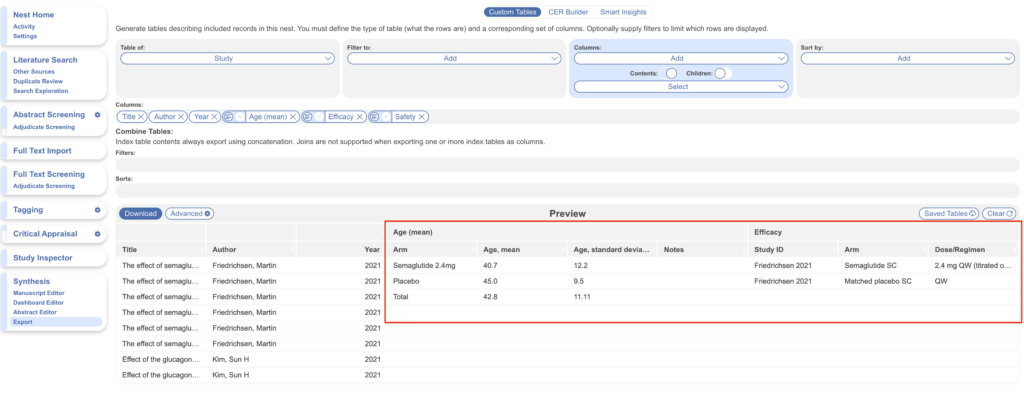
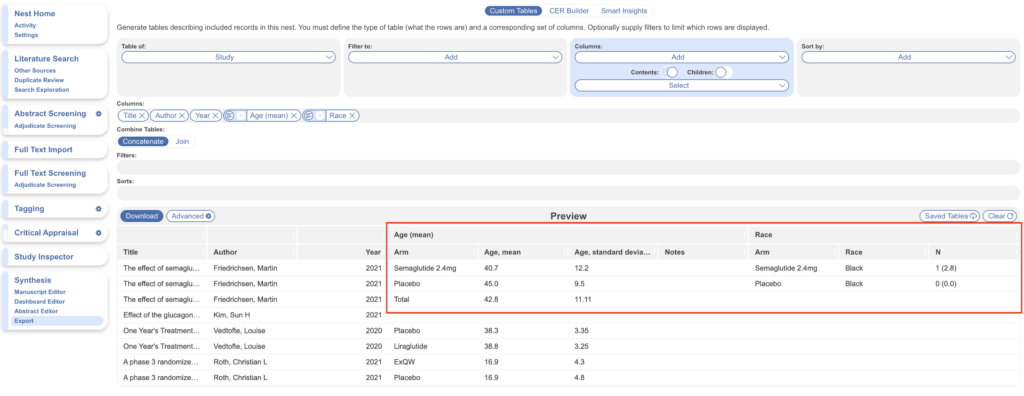
Concatenation is the default and requires no action. Tables are displayed side by side exactly as filled out, with additional rows created for a study as needed. Matching column headers are not merged — if two tables each have an Intervention column, both columns appear. Index Tables can only be exported using concatenation.
OR
Joins
Joins merge columns that share similar names. Select Combine Tables: Join, and Nested Knowledge attempts the joins automatically — for example, two tables sharing an “Arm” column will be combined into one below.
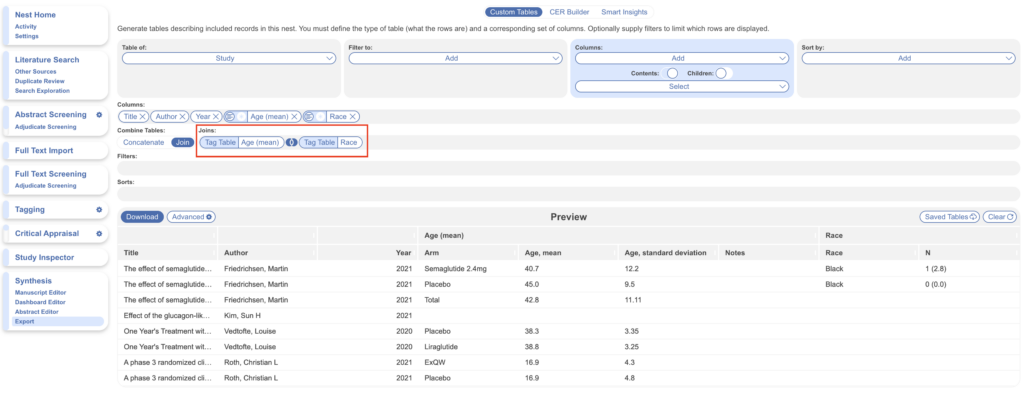
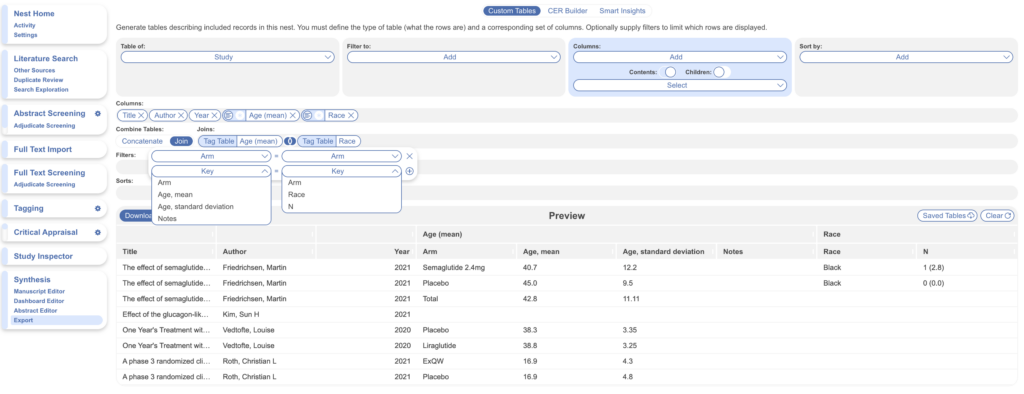
Because joins are assigned automatically, they can be incorrect. To fix one, click the icon between the listed tag tables and click X on the incorrect joining; from the same panel you can also manually join other columns from each table as appropriate.
4. Sort Studies (Optional) #
You can control the order of studies in the table, sorting by bibliographic data, meta-analytical extraction (if applicable), or assigned related report families.
5. Reorder or Remove Columns #
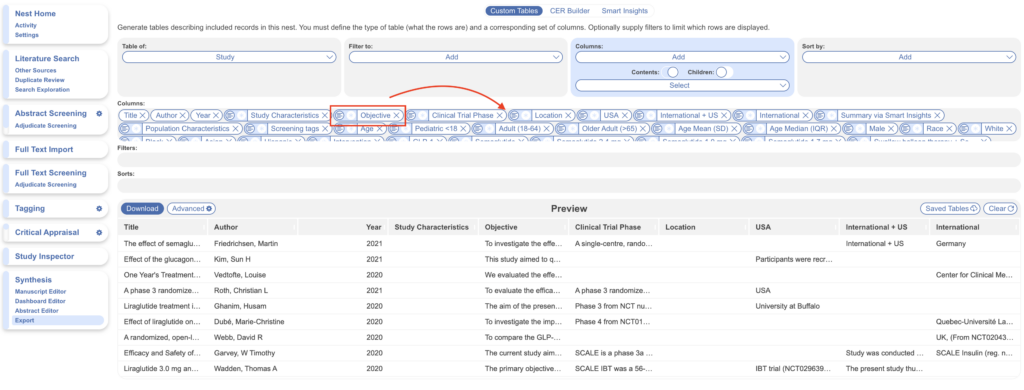
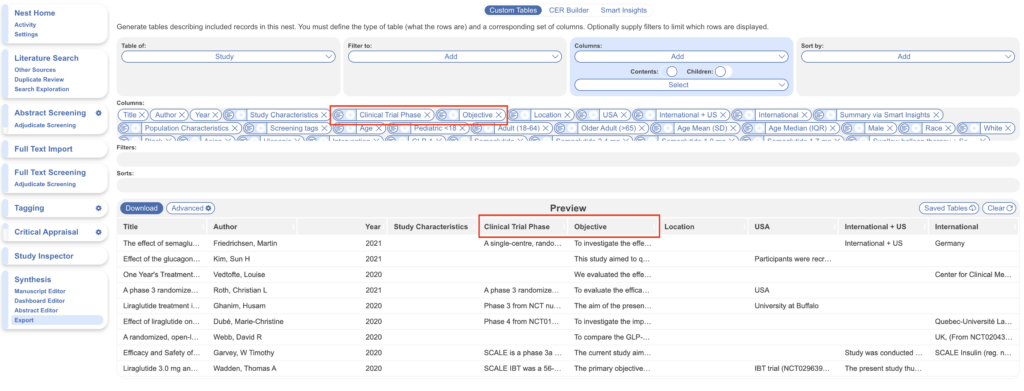
To change the order of columns, drag and drop the column pills; the table reorders accordingly. To remove columns from the table click the X next to the corresponding column pill.
Saving Your Table #
The Table Builder resets when you refresh the page, so if you have invested time in a build, save it. Add a name and click save; when you return to the Export page, open Saved Tables and select the name to auto-populate the builder with your saved configuration.
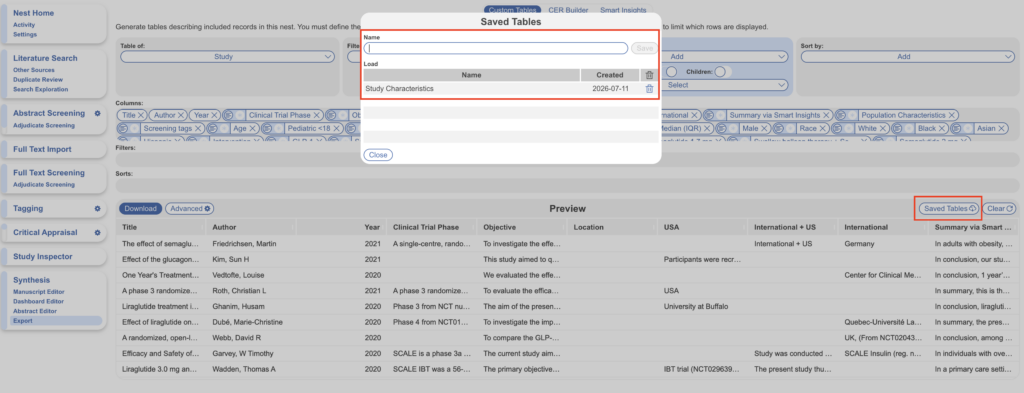
On the Dashboard Editor, saving is inherent — the table lives on as a card in your Dashboard and updates as the nest changes.
Advanced Settings #
Export page only. Before downloading, check the Advanced setting. By default, when your table includes tag columns organized under separate root tags, the data under each root tag is exported to its own sheet within the workbook, with each sheet titled by root tag — a useful way to organize large datasets. If you would rather have all columns in a single sheet, uncheck the box.
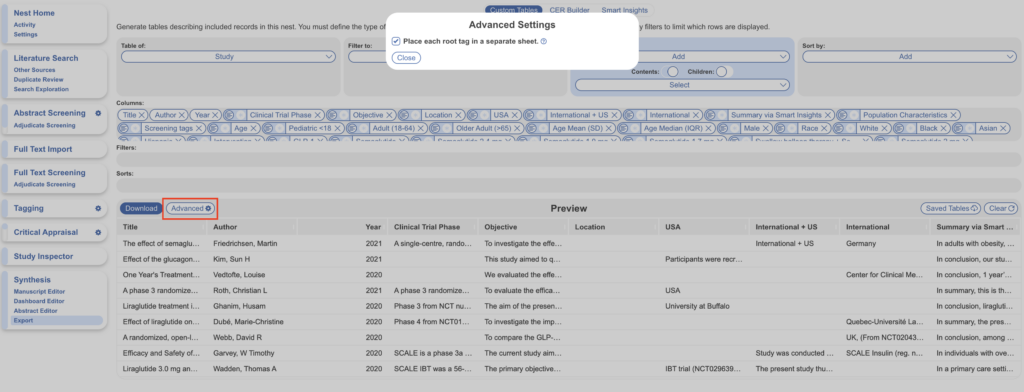
When your table is configured, click Download.