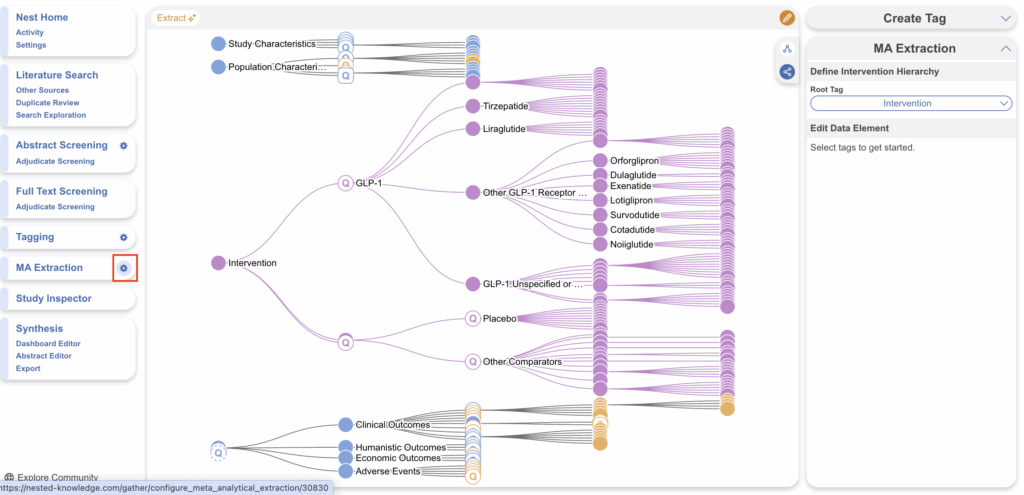
In order to perform meta-analytical extraction, you first need to Configure Interventions and Data Elements, which you do from the Configure MA Extraction page in order to reuse the tag hierarchy.
Interventions correspond to the types of therapies/treatments/medications etc. that were compared across the articles and appear as purple in the Tag Hierarchy.
Data Elements refer to all other relevant data from the article that will be extracted for meta-analytical data and appear as gold in the Tag Hierarchy.
Note: Only one hierarchy can be designated as your Intervention hierarchy, but any node in your hierarchy can be configured as a Data Element. There is no requirement, however, that every tag be configured as a data element!
Configure MA Extraction Page:

Configuring Interventions #
1. Navigate to MA Extraction Configuration panel #
When you click on the Configure MA Extraction page, the MA Extraction Configuration panel should automatically open.

2. Define Intervention Hierarchy #
You’ll be prompted to select a root tag from the dropdown that encompasses the interventions you’d like to assign. For reference, in the below example, the Interventions root tag is highlighted in the dropdown as well as in the hierarchy.
3. Interventions are Assigned Purple #
Selecting a tag for interventions turns it and its child tags purple.
Intervention tags can easily be changed, simply select another tag in the dropdown. This is important to note because this is the first piece of data to be extracted in when you go to perform MA extraction. If incorrect tags are assigned as interventions in Configure MA Extraction, these incorrect Interventions options will appear under the Intervention drop-down menu instead of the “Interventions” tags. Below is what you want to see after configuring correct interventions.
Configuring Data Elements #
1. Assign Data Elements #
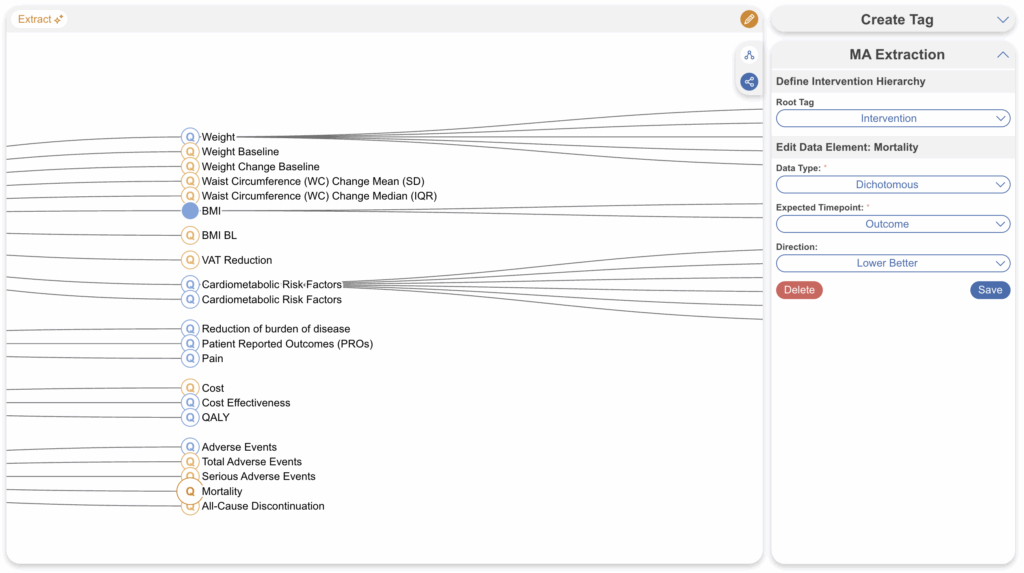
Select a tag from the hierarchy to turn the tag into a Data Element. In the below example, Mortality was selected and can now be configured in the right hand tab.

2. Select the Data Type #
Continuous, Dichotomous, or Categorical (Mandatory)
Depending on the data type, different inputs will populate. For example, if a data element is categorical, you will be able to specify the different categories.
3. Select the Expected Timepoint #
Baseline or Outcome – Choose the Expected Timepoint based on whether the data was collected at Baseline or as an Outcome (Mandatory).
If the data element can be both a Baseline and an Outcome, choose Baseline.
4. Select the Direction #
Higher Better or Lower Better (if applicable) – For example, the Data Element is “Mortality”, Lower Better would most likely be appropriate.
5. If Continuous, include units and central tendency measurements #
Example: Minutes, mL, kg (if applicable). Mean or Median (Mandatory for continuous variables) – After choosing Mean or Median, it will also ask you about “Dispersion Measure” (SD for Mean; IQR or Range for Median).
6. If Categorical, add custom categories #
7. Click Save #
Confirm that the configuration worked based on whether the node turned gold, and move on to configure any other Data Elements of interest.
How many Data Elements should you create? #
When configuring your Data Elements, it is vital to recognize that every Data Element you configure must be:
- Collected as a metric across all studies, adding time to your project, and
- Presented on Synthesis, potentially confusing readers as to which Data Elements are vital to your review/meta-analysis.
It is also important to understand that, unlike with primary studies, multivariate comparisons are limited in meta-analytical research by the aggregated nature of the data. Thus, all Data Elements should be of direct interest to compare among Interventions of interest.
There is no exactly ‘correct’ number of Data Elements. However, remember that: the minimum # of metrics collected = # of study arms * # of Data Elements configured, and this can increase if multiple timepoints are collected.
Therefore, the following suggested guidelines may help estimate the appropriate number of Data Elements and project timelines:
- 1-3 Data Elements: <5 min per study, highly focused Synthesis. May provide too little context for key outcomes, but optimizes project timelines & ease of quality control.
- 4-7 Data Elements: 5-10 min per study, focused Synthesis. Likely represents the primary & secondary outcomes of interest, as well as high-value background data.
- 8-10 Data Elements: 10-20 min per study, detailed Synthesis. Likely represents all primary & secondary outcomes of interest, subsidiary endpoints, and any background data of interest. Data sparsity may be a problem. Recommended that you keep your review to this size or smaller!
- 10-20 Data Elements: Up to an hour per study, intensively detailed Synthesis. Likely represents most data elements reported in underlying studies; may represent an unfocused research question. Should be reserved only for extensive reviews where the endpoints of interest are undefined, or review types that require going beyond conventional methods.
- 20+ Data Elements: Several hours per study, potentially overwhelming Synthesis. Can introduce not only data sparsity but collection quality concerns. May reflect an unfocused research question or unconventional review type. Recommended that such reviews be split into smaller pieces if they must be undertaken.
These are suggestions only, but can have major impact on the quality, focus, and timeliness of projects. If you have any questions on this guidance, feel free to Contact Support!

