When extracting data using tags, text contents usually suffice to capture evidence for simple data points, but for more complex data extraction, it can be helpful to configure and fill out table contents or “Tag Tables.” Tags can only have one type of content, e.g. text or table contents.
Tag Tables can serve as an alternative to the Meta-Analytical Extraction module, since it is much less time-intensive. If you are not performing a network meta-analysis and/or your project doesn’t have explicit interventions but you still want to collect quantitative data, then Tag Tables are a great option due to their greater flexibility and customizability than MA Extraction.
For even more complex extraction needs, such as data stratified by study arms across multiple outcome domains, this page also covers Index Tables, a two-layer table structure that links sub-tables to a shared index. Read on for standard Tag Tables first, or skip ahead to Going Further: Index Tables.
What is a Tag Table? #
A tag table is:
- A user-configured spreadsheet
- Attached to any Tag in your hierarchy, which allows text or numerical extraction
- A collection tool enabling multiple rows of data to be collected on a single study
- Exportable into Excel
When should a Tag Table be used? #
Tag Tables are useful for a variety of use cases including the collection of:
- Information on Subgroups
- Inclusion/exclusion criteria
- Patient characteristics/comorbidities
- Hazard / odds ratios and comparators
- Dosages, schedules and concomitant medications
- Qualitative Outcomes Reporting
- Diagnostic accuracy data
- Table replication from study
Read our blog on Tag Table Use Cases for more information.
If your extraction involves data that needs to be linked across multiple domains by a shared row identity (e.g., efficacy, safety, and demographics all stratified by study arm), consider using an Index Table instead.
Configuring Tag Tables #
1. Select Tag and Content Mode: Table #
Configuring tags with table contents is compatible with all tagging modes and once a tag has been created, a table can be configured alongside it. First, ensure you are edit tag mode (red), select the tag you’d like to add a table to (blue), ensure Tag Details are filled out (orange), then select “Table” under Content Mode (pink).
Note: Tag Tables is tag-specific, it only applies to tags where it is toggled on and tables are created from scratch for each tag of choice.
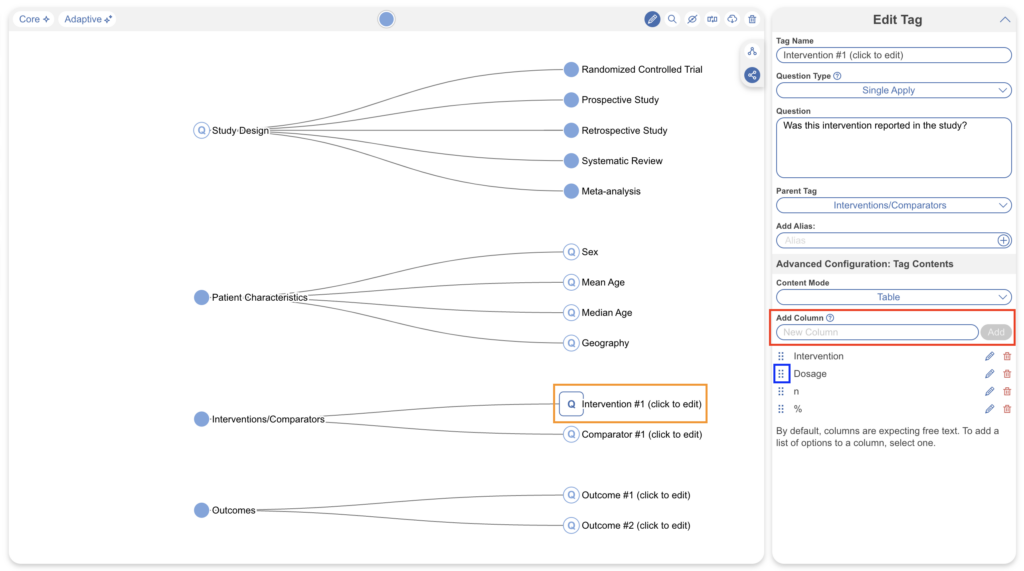
2. Add Columns #
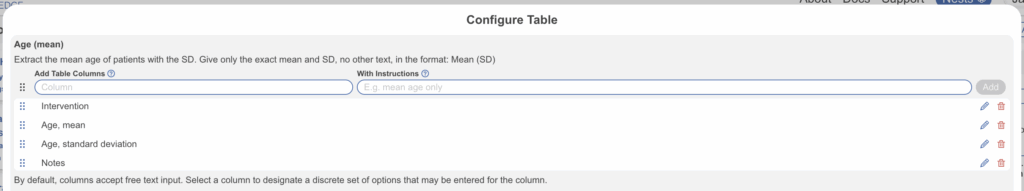
Once Table mode is selected, select Configure Table Columns to open the modal. Here you can add columns of your choice. You can customize the columns of your table for data extraction exactly how you’d like them to look in an export. Specifically, columns listed here from top to bottom are displayed in the actual extraction table from left to right, and exported this way too. You may include instructions for each column as needed.
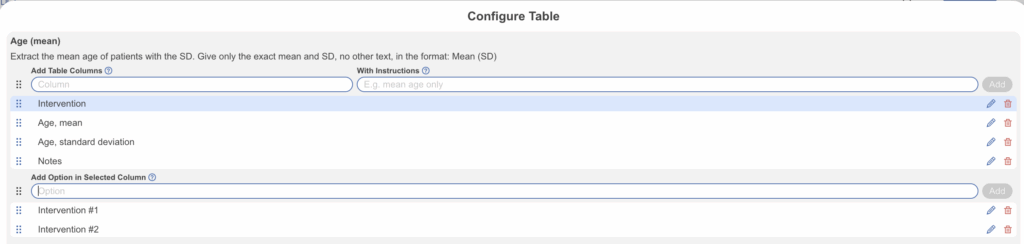
To reorder, drag and drop; this can be done anytime without affecting any extracted data. To edit the column header and instructions select the pencil icon, select the row to add pre-specified options under the column, otherwise it’ll be free text. To delete select the trash icon. Be careful deleting columns with existing data as that will be erased too. Once a tag table is created, the icon shape change to square instead of circular.
The configured tag table above will look like the below tag table in Tagging. Beneath each column is free text for you to fill out before selecting “Apply” tag and will auto-add new rows as you fill out larger sets of data. Continue reading for guidance on creating options within columns instead of free text.
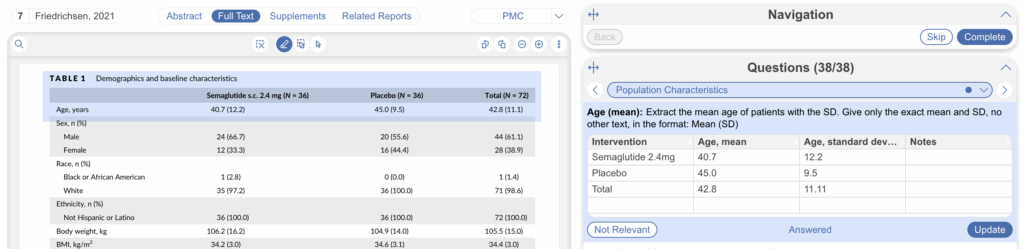
3. Extract Tag Tables in Tagging #
Now your tables are configured, simply head to the Tagging module and start filling them in.
Additionally you can edit column headers and options on the fly by selecting the header (red) and editing within the modal:
Ultimately, if you are looking to extract any type of data into a spreadsheet from underlying studies, you’re far better served to turn a Tag into a Tag Table.
Going Further: Index Tables #
Standard Tag Tables work well for single-domain extraction with one flat table per tag. But in many evidence synthesis projects, particularly in HEOR, HTA, and CER, the data you need to extract is multi-dimensional: efficacy outcomes, safety data, and baseline demographics all reported per study arm, all needing to stay linked. This is where Index Tables come in.
What is an Index Table? #
An Index Table is:
- A two-layer extraction structure attached to a tag in your hierarchy
- A primary index (the “spine”) that defines the identity of each data row—typically study arms or comparator groups
- One or more sub-tables that attach to the index, each capturing a different domain of data (e.g. efficacy outcomes, safety, demographics)
- A wide-format data structure where each row represents one unit (e.g. one study arm) and each data point is its own column
The index columns act as a shared anchor across all sub-tables, functioning like a foreign key in a relational database. This means every row of outcome data, adverse event data, or demographic data can be traced back to exactly one study arm in the index without repeating arm-level details in every sub-table.
Why use Index Tables? #
In evidence synthesis, clinical data is rarely flat. A single study may report outcomes across multiple treatment arms, at several timepoints, for different subpopulations. Traditional extraction approaches force you to either build one very wide, unwieldy table or create several disconnected tables that lose the relationship between arm and outcome.
Index Tables address this by keeping extraction modular yet structurally linked. The key benefits are:
- Preserve arm-to-data relationships structurally rather than relying on manual conventions or repeated data entry
- Keep extraction forms manageable by breaking a complex dataset into logical, domain-specific sub-tables
- Produce export-ready spreadsheets that directly mirror the format needed for downstream analysis, HTA dossiers, or CER submissions
- Reduce extraction errors by eliminating redundant re-entry of study arm identifiers across multiple data domains
Tag Tables vs. Index Tables # #
Understanding when to use an Index Table versus a standard Tag Table comes down to one question: does your data need to be linked across multiple domains by a shared row identity?
| Feature | Standard Tag Table | Index Table |
|---|---|---|
| Structure | Single flat table | Primary index + one or more sub-tables |
| Row identity | Each row is independent | Index columns anchor every row across all sub-tables |
| Data format | Rows can be long (stacked) or wide | Wide format only: one row per unit (e.g., study arm) |
| Best for | Simple tabular data: inclusion criteria, dosage schedules, single-domain extraction | Multi-domain extraction: outcomes + safety + demographics, all stratified by arm |
| Export | Single spreadsheet per tag | Index sheet + linked sub-table sheets, or a combined wide export |
| Relationship to MA Extraction | Alternative to MA Extraction for simple quantitative data | Alternative to MA Extraction for complex, arm-stratified data without requiring formal intervention configuration |
Rule of thumb: If you only need to capture one category of data (e.g. a list of adverse events, or a set of baseline characteristics), a standard Tag Table is sufficient. If you need to capture multiple categories of data that all share a common identifier like study arm, use an Index Table.
When should an Index Table be used? #
Index Tables are particularly well-suited for the following use cases:
- HEOR and HTA submissions where efficacy, safety, and baseline data must be extracted per study arm in a format that mirrors evidence tables in dossiers
- Systematic reviews of RCTs where outcomes are reported per intervention/comparator arm and you need to maintain the arm-level linkage
- Comparative effectiveness research where you are collecting multiple data domains (clinical outcomes, patient-reported outcomes, resource use) across treatment groups
- Multi-arm trials where three or more arms need to be tracked consistently across outcome categories
- Any review where your desired export format is a wide spreadsheet with one row per study arm and columns for each extracted data point
Configuring Index Tables #
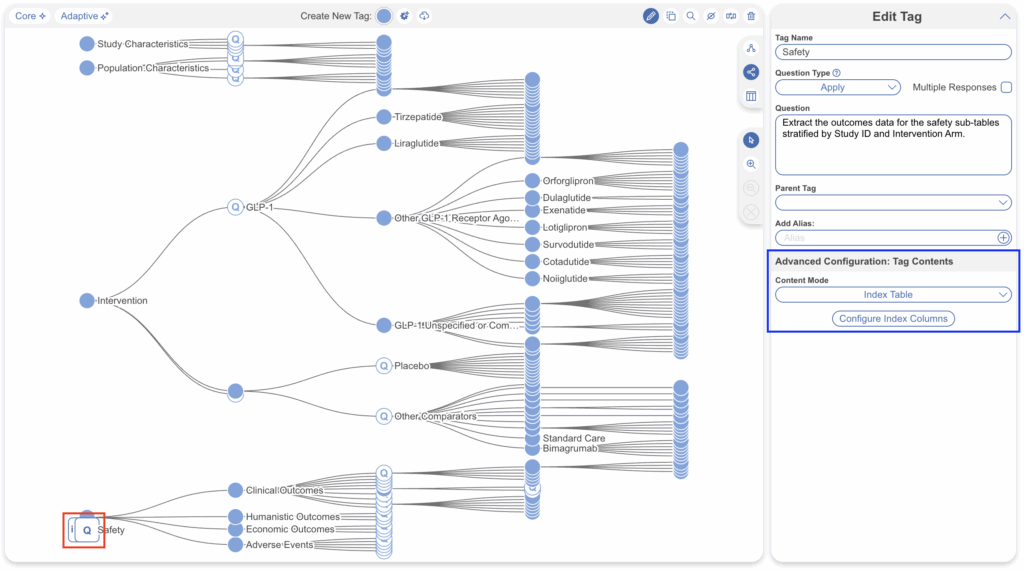
1. Select Tag and Content Mode: Index Table #
Configuring Index Tables follows the same starting workflow as standard Tag Tables. Ensure you are in edit tag mode, select the tag you’d like to attach an Index Table to, ensure Tag Details are filled out, then select “Index Table” under Content Mode and Configure Index Columns.
Note: Like standard Tag Tables, the Index Table is tag-specific and configured from scratch for each tag.
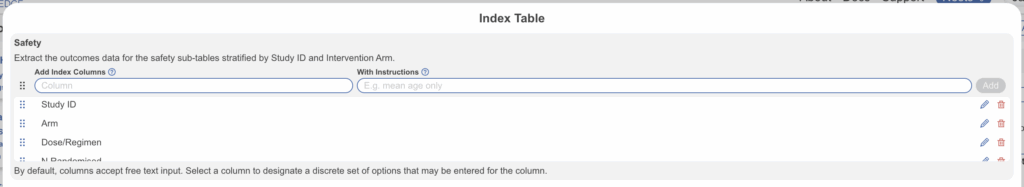
2. Define the Index Columns #
The index is the primary layer of your Index Table. It defines the columns that will be shared across all sub-tables as the row anchor. Think of these as the columns that answer: “Which study arm does this data belong to?”
Typical index columns for HEOR and clinical review projects include:
- Study Arm / Comparator — the label for each treatment group (e.g. “Semaglutide 2.4 mg”, “Placebo”)
- Intervention — the drug or device name
- Dose / Regimen — dosing details
- N (sample size) — the number of participants randomised to each arm
The test for whether a column belongs in the index: does this information apply to every sub-table equally? If yes, it belongs in the index. If it only matters for one domain (e.g., timepoint only matters for efficacy, not demographics), it belongs in that specific sub-table.
Add index columns and configure options where applicable, just as you would when adding columns to a standard Tag Table. Columns with known, finite values (e.g., arm names) are good candidates for dropdown options to ensure consistency across studies.
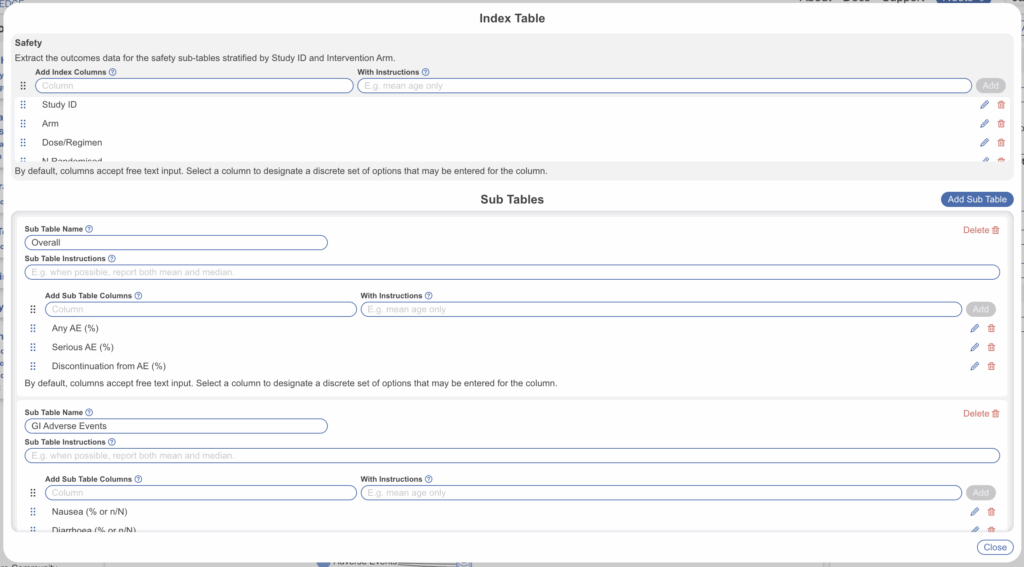
3. Create Sub-Tables #
Once your index is defined, create one or more sub-tables. Each sub-table represents a distinct domain of data that will be linked to the index. Common sub-tables include:
- Efficacy Outcomes: endpoint, timepoint, result, treatment difference, p-value
- Safety / Adverse Events: AE type, incidence, severity, discontinuation rates
- Baseline Demographics: age, sex distribution, BMI, comorbidities
- Study Characteristics: design, duration, setting, primary endpoint
Each sub-table automatically inherits the index columns, so you only need to configure the domain-specific columns for each. As with standard Tag Tables, you can configure each column as free text input or as a dropdown of predetermined options.
For example, in an Efficacy Outcomes sub-table you might configure:
- Timepoint (free text or options, e.g., “Week 12”, “Week 24”, “Week 52”)
- Baseline Value (free text)
- % Change from Baseline (free text)
- Treatment Difference vs. Placebo (free text)
- p-value (free text)
Columns are displayed left to right in extraction and export in the order they are listed top to bottom in configuration. Drag and drop to reorder at any time without affecting existing data.
5. Extract Index Table Data in Tagging #
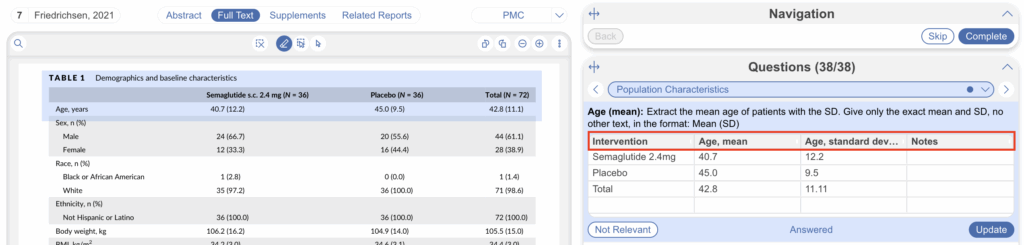
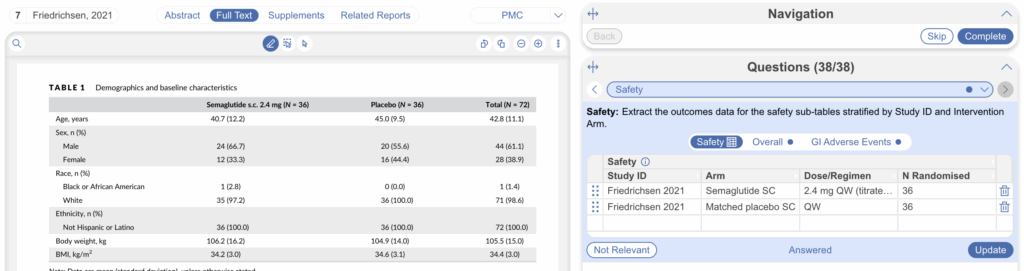
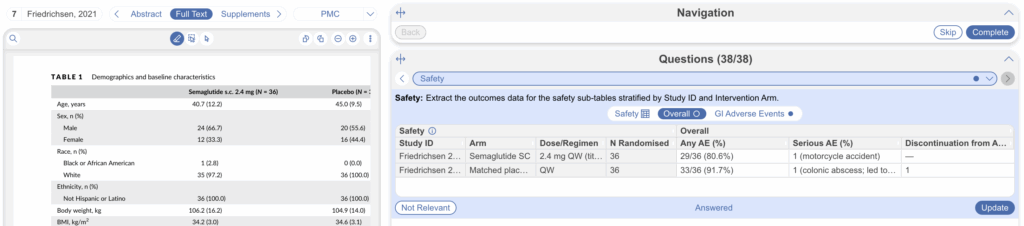
Once configured, head to the Tagging module to begin extraction. The Index Table will display with the index columns on the left (visually distinguished) and the active sub-table as separate tabs to the right. You can switch between sub-tables to extract data for different domains, with the index columns always visible as the row anchor (see below: “Safety” is the index tab, “Overall” and “GI Adverse Events” are sub-tables).
Each row in the index represents one study arm. Fill in the index once, then populate each sub-table’s columns for that arm. Select “Apply” to save your extraction. You can also edit column headers and options on the fly by selecting the header, just as with standard Tag Tables.
How Index Tables Export #
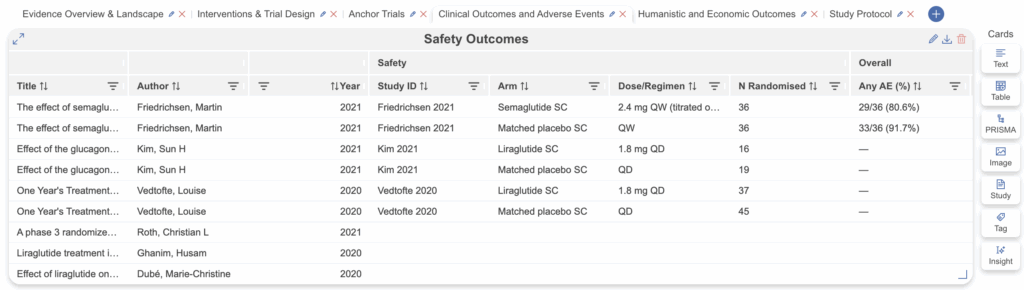
When built in Dashboard, Index Tables can be combined, housed and export into Excel in a single sheet.
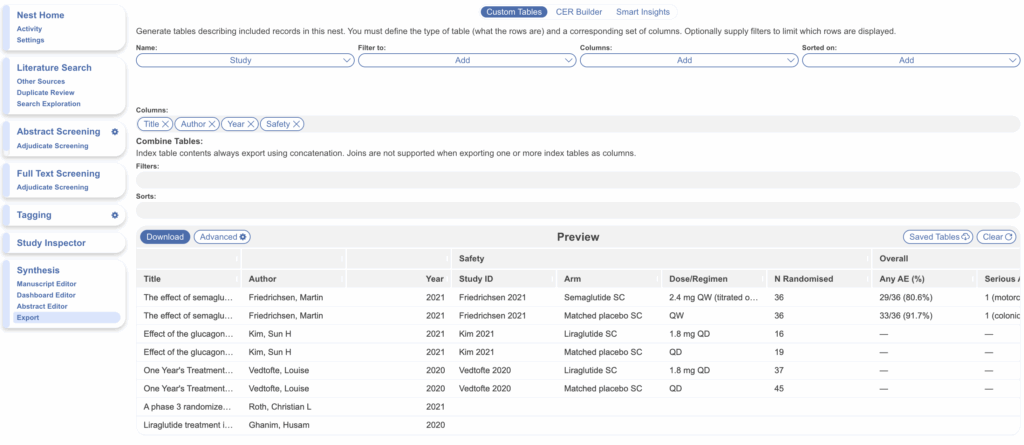
When built in Export, Index Tables can be combined and exported as separate sheets in the same workbook.
Best Practices for Index Table Design #
- Keep the index lean. Only include columns that are universally relevant across all sub-tables. Study Arm, Intervention, Dose, and N are almost always sufficient. Population or Subgroup may be needed if the study reports results for multiple analysis sets (e.g. ITT vs. per-protocol).
- Use options for index columns wherever possible. Dropdowns for arm names and interventions enforce consistency across studies, which is critical for clean exports and downstream filtering.
- Design sub-tables around your target export. If you know your deliverable is an evidence table with specific column headers, configure your sub-tables to match those headers directly. The goal is zero post-export restructuring.
- One sub-table per data domain. Resist the temptation to put all data into a single wide sub-table. Separate sub-tables for efficacy, safety, and demographics keep extraction manageable and allow team members to work on different domains in parallel.
- Test with one study first. Before rolling out Index Tables across your full review, configure and extract for a single representative study. Verify the export matches your expected format, then proceed.
In addition to text and table contents, you can configure text options, which displays a dropdown only with no accompanying text for more simplified data extraction. Learn more about configuring text options.