Blog
How Smart Study Type Tags Are Reinventing Evidence Synthesis
One of the features of Core Smart Tags is Smart Study Type – this refers to our AI system that automatically categorises the study type

When reviewing the literature, the types of information collected from underlying studies can vary widely. In your project, you may need to synthesize data that are highly quantitative and combinable, such as performing Network Meta-analysis of overall survival in lung cancer at consistent timepoints, while in others, you might collect information that is qualitative and driven by ideas more than numbers, such as a systematic review of treatment methods for lung cancer. Many reviews mix qualitative and quantitative information, gathering not only key outcomes but the underlying studies’ methods and inclusion criteria alongside meta-analytical endpoints; in those cases, you may need multiple methods of collection that are scoped to each type of evidence being gathered. Thus, typical extraction methods include:
However, there is not a simple dichotomy between ‘qualitative’ and ‘quantitative’ extraction. You can also extract contextual information (the dosages of interventions), inferential statistics (hazard ratios and p-values) and even images (survival curves across study groups). These types of evidence do not fit neatly into ‘direct text’ or ‘meta-analytical data’, but they still require a systematic approach to collection–and often need to be collected in very specific ways to be useful. So, in your review, how can you capture data types that do not match with these conventional methods?
Tag Tables are a flexible spreadsheet-like extraction mechanism meant to cover these various data types that are not amenable to direct-text or meta-analytical extraction. They are easily configurable under any Tag, so no new hierarchy-building is needed, and they are available in both Qualitative Synthesis and export. In their most simple form, a Tag Table is:
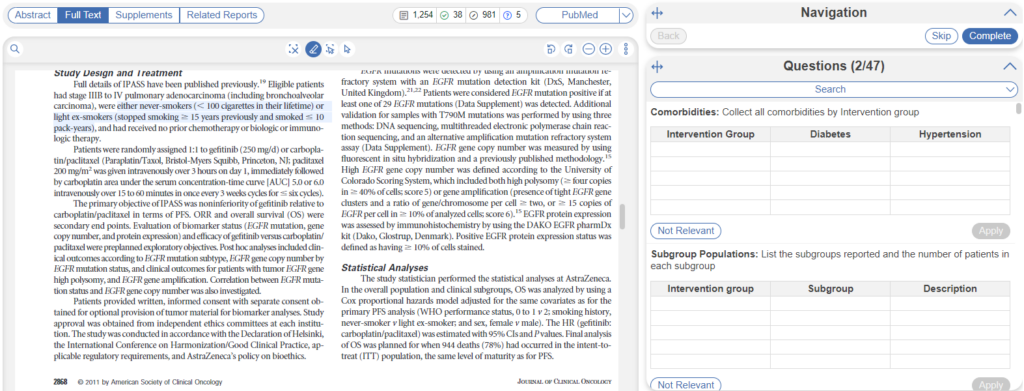
As shown above, these Tag Tables can be displayed directly next to your full text in Tagging, and once configured, can be rapidly filled in to answer questions with sufficient complexity to need spreadsheet-like, flexible gathering. Therefore, Tag Tables should be easy to understand and adopt, since they act like the spreadsheets you may be used to in data extraction. While this is straightforward in concept, it provides a very high degree of customization to your needs and thus presents many opportunities to either make or break your project. So the most important task related to Tag Tables is determining when and how to set them up for a successful review.
A Tag Table can be configured for any Tag in your hierarchy. Whether in Standard or Form-based Mode, simply open the tag in question, click on “Contents”, and toggle Tag Tables “on,” From there, you can configure the columns in your Table, which will be presented when gathering data from each underlying study.
Once you are collecting, the Tag Table for any given question can be filled in for an unlimited number of rows. If the columns need to be edited, you can reconfigure ‘on the fly’ by simply clicking on the column headers, which will adjust these headers across all studies.
So, the mechanics are easy; the key question is, when and how should Tag Tables be configured?
Now, we come to the important questions: What unmet needs to Tag Tables serve? When are they advantageous over normal tags? What types of data do they work for? And then, of course, what do they look like in action and what are their limitations?
Tag Tables serve the unmet need for flexible, configurable extraction. Since this is so wide-ranging and general, it’s best to examine applicability based on specific use cases, such as:
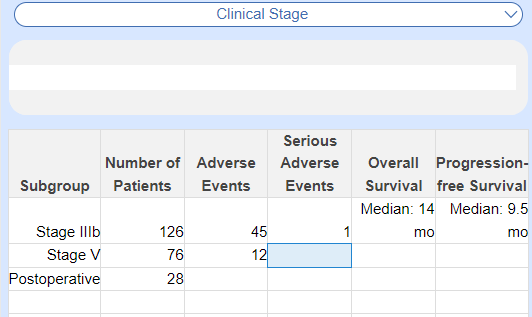
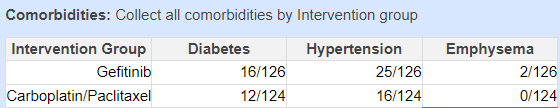
Tag Tables can be used to show which subgroups were identified within a study and collect data at the subgroup level (such as biomarker-based subgroups, clinical stage, or previous therapy), rather than just data associated with the Interventions. You can break down any data–population sizes, comorbidities, even adverse events or outcomes–by collecting simple numerical data, or provide statistical context in addition:
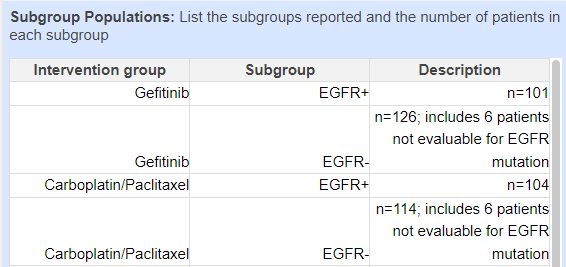
You can also break this out by multiple categories, such as breaking down subgroups within each intervention/study arm:
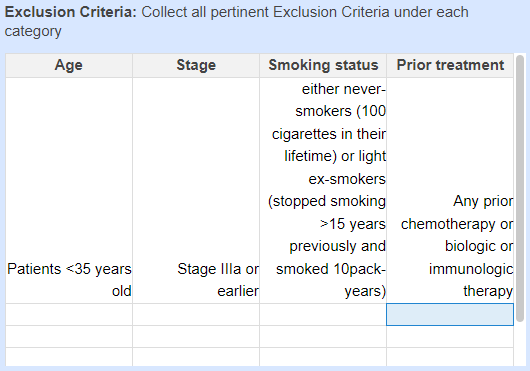
It is often difficult to compare criteria side-by-side without a topic-by-topic table comparing different criteria (down to the exact wording) of inclusion and exclusion criteria. While studies focused on these criteria can also use normal Tagging, that process can be more intensive (since a tag needs to be applied for each criterion) and Tag Tables provide a basic structure for such comparisons:
This is another data type that could potentially be captured by MA Extraction. Choose Tag Tables if you’re looking for a quick method to extract simple numerical information that does not require automated meta-analysis!
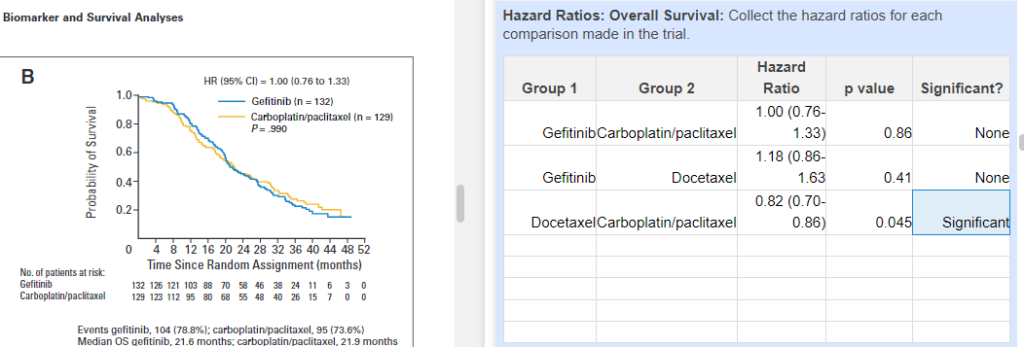
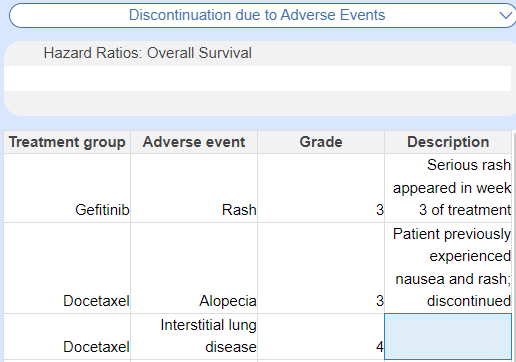
While MA Extraction enables collection of descriptive statistics and their context, hazard ratios are best collected in Tag Tables so that the groups in question can be identified as well as 95% Confidence Intervals and p-values:
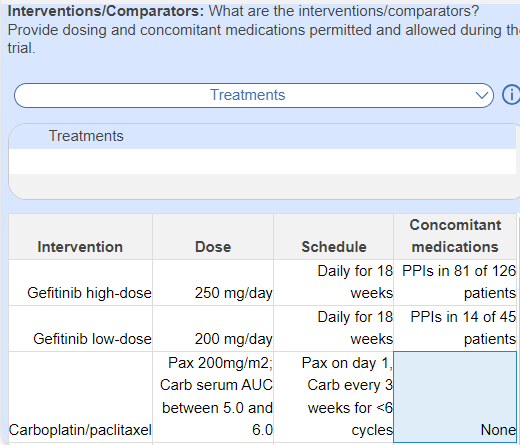
While study groups are sometimes broken down by dose (in which case MA Extraction may be sufficient), giving qualitative details related to dose, schedule, and concomitant medications across all Intervention groups in a single sheet is easy to accomplish in Tag Tables:
From Adverse Events to Patient Reported Outcomes (PROs), there are many outcomes that are not as simple as overall survival. While these can be collected using MA Extraction if they are dichotomous or continuous (or categorical), the more complex or qualitative the outcome (and the more detailed or descriptive the findings), the more likely Tag Tables should be used:
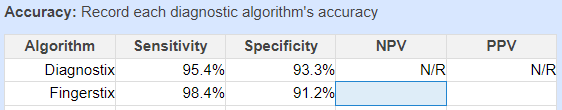
If a data type is not currently captured in MA Extraction, but you’d like it in spreadsheet format, Tag Tables can capture many elements without too much proliferation of individual Tags. For example, if collecting sensitivity, specificity, positive predictive value, etc. across different diagnostic algorithms, you can collect these in a Tag Table:
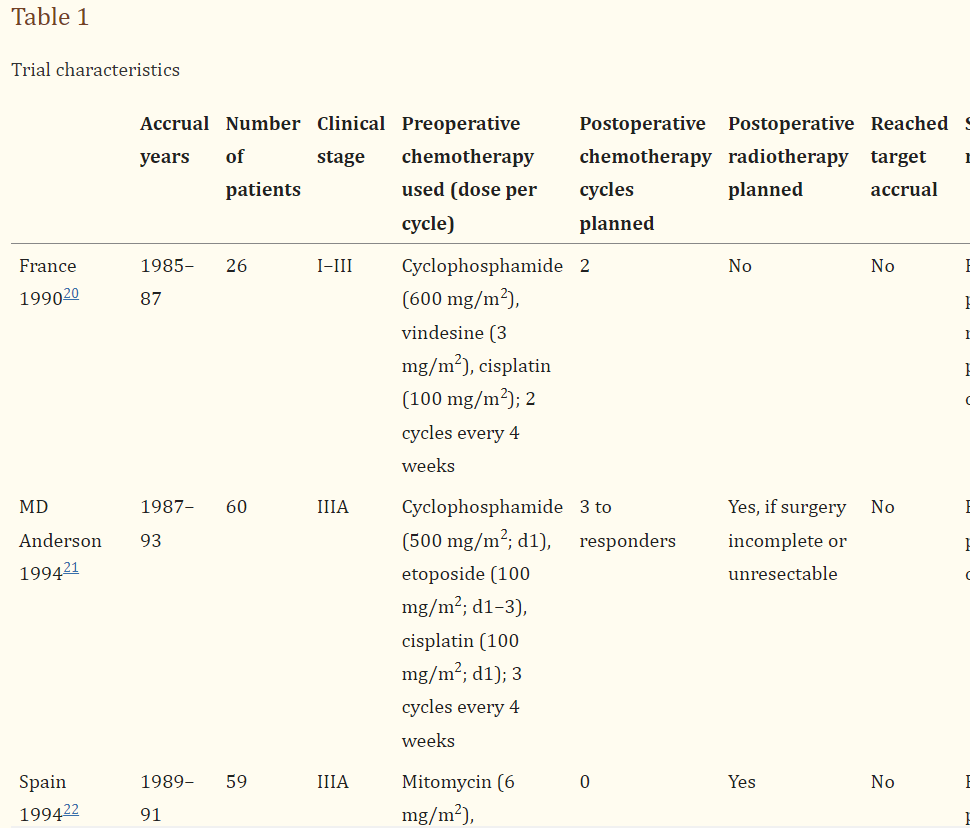
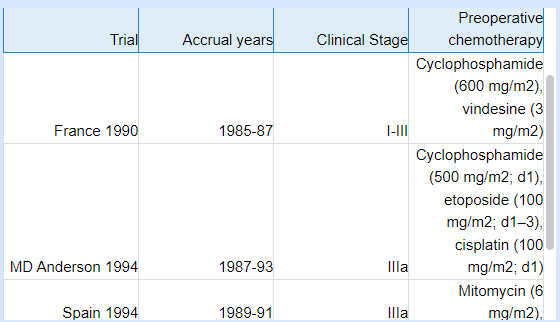
In some cases (such as when replicating a table of previous studies on the topic), you may want to pull all data from a table, either verbatim or with some adjustments. In that case, you can build a Tag Table that reflects the exact or approximate table from the underlying study:
You can probably see a trend here–if you are looking to extract ANY data into a spreadsheet from underlying studies, you’re far better served to turn a Tag into a Tag Table. Tag Tables export into Excel, but have the advantage of being presented (already-configured) next to your full text, with editability on-the-fly and flexibility to any type of information you’re extracting. The above examples should help make this concrete, but the inherent flexibility of Tag Tables means that you can set up your own novel use case!
If you’re configuring a Tag Table for arm-level data extraction (e.g., for ASTs or meta-analysis), consider these key tips from our Tagging Hierarchies Best Practices blog:
Tip for Configuration
For ASTs or network meta-analysis, it’s especially helpful to structure your Tag Table with a “Study Arm” column and Outcome Measure columns, grouping rows by study. This enables table exports that are meta-analysis–ready.
Learn more from the full guide:
Tips & Tricks of Configuring Nested Knowledge’s Tagging Hierarchies for ASTs
This huge range of uses should show the power of Tag Tables for flexible, self-configured extraction. However, there are some limitations that you should consider in case your use case does not match the capabilities of Tag Tables:
SLRs and meta-analyses often need to take in highly varied formats of data. While Tagging with text excerpts supports qualitative collection of exact quotes and MA Extraction supports automated NMA of structured data elements, Tag Tables should be your go-to extraction method for any information that requires flexibility– that is, data that mix text and numbers, data about subgroups or dosing or background therapies, data that inherently compare multiple concepts from within studies (e.g. adverse events by biomarker group), even methods such as exclusion criteria– and that would fit well into a spreadsheet.
Tag Tables take practice and creativity, but they are a critical tool to capture data that does not fit into ‘text’ or ‘structured data element.’ So, armed with this explanation of a wide variety of use cases, start your next review with this question top-of-mind: “Am I (1) annotating the PDF to extract text? (2) extracting dichotomous, categorical, or continuous data across Intervention groups? Or (3) building my own custom spreadsheet?” If your answer is (3), set up a Tag Table and build out your extraction structure–your way.
If you have any questions, never hesitate to reach out to support@nested-knowledge.com. Our team loves Tag Tables and would be happy to help with your extraction strategy and study design!
Yep, you read that right. We started making software for conducting systematic reviews because we like doing systematic reviews. And we bet you do too.
If you do, check out this featured post and come back often! We post all the time about best practices, new software features, and upcoming collaborations (that you can join!).
Better yet, subscribe to our blog, and get each new post straight to your inbox.
One of the features of Core Smart Tags is Smart Study Type – this refers to our AI system that automatically categorises the study type