Welcome to the walkthrough of the Non Small Cell Lung Cancer: Tyrosine kinase inhibitors demo Nest for Health Technology Assessments (open in your original tab). In this walkthrough, we’ll explain the core functionalities of Nested Knowledge through this Nest. We encourage you to work through the Nest as you follow the walkthrough. The Nest available to you is a copy of the original and may be freely modified, so roll up your sleeves and get your hands dirty!
This Nest is a demonstration of a previously-completed review as part of a HTA project, presenting a comparison of patient outcomes from treatment of NSCLC with different types of TKIs. It is partially completed to allow you to explore the site.
Nest Home #
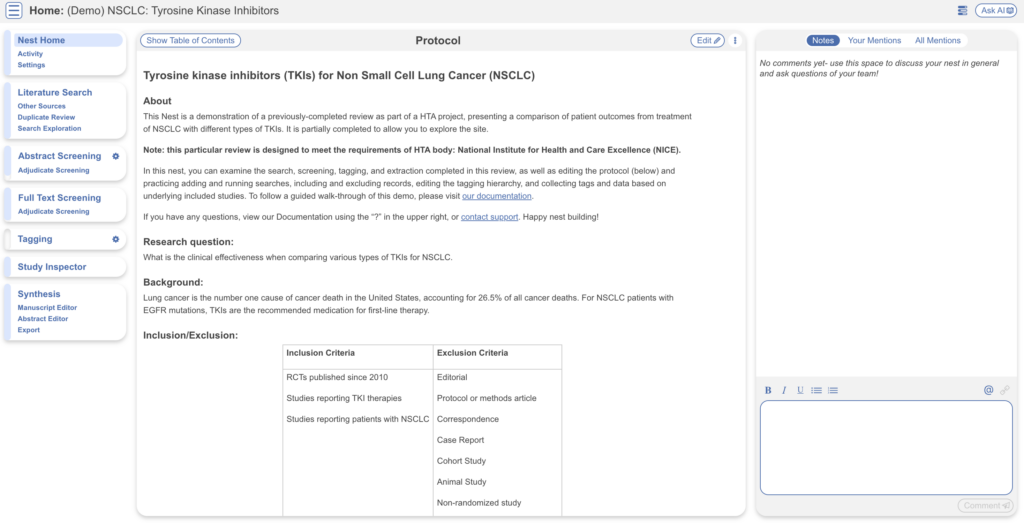
You’ve landed on your demo Nest in AutoLit, and you’re looking at the Nest Home page. This page includes a menu on the left of the page, the protocol in the center, and discussion about the Nest on the right. The menu includes links to all modules & configurations available to you in AutoLit. We’ll now walk through these modules one by one. (click the title in the menu to navigate to the the corresponding module).
Literature Search #
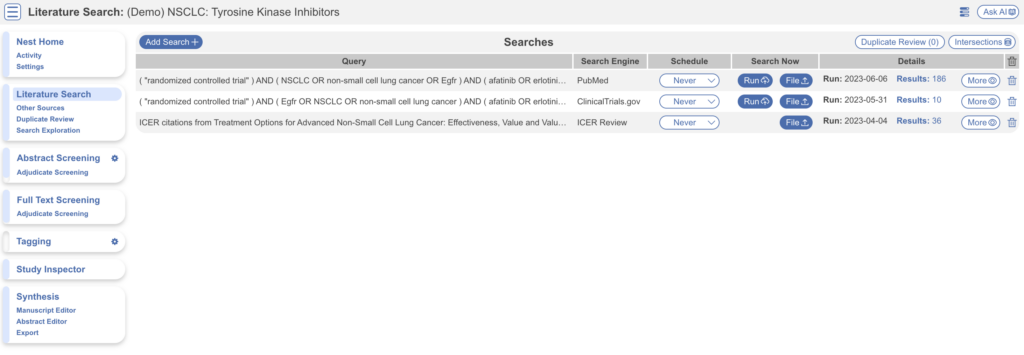
The Literature Search page allows import of studies to a nest and shows where studies were sourced. This review includes three searches – two API-based (automatic integration) search of PubMed and ClinicalTrials.gov and a file-based import from another source. In this case, the file was uploaded from the ICER review, but typically you would upload files from databases such as Embase. Hover and click the “More” button to see greater detail about the searches, including when they were run and any query structuring available. The PubMed and ClinicalTrials.gov searches are API-based and are set to run weekly. However, you can click the “Run” button to update the search at any time- you may import some new records!
Other Sources #
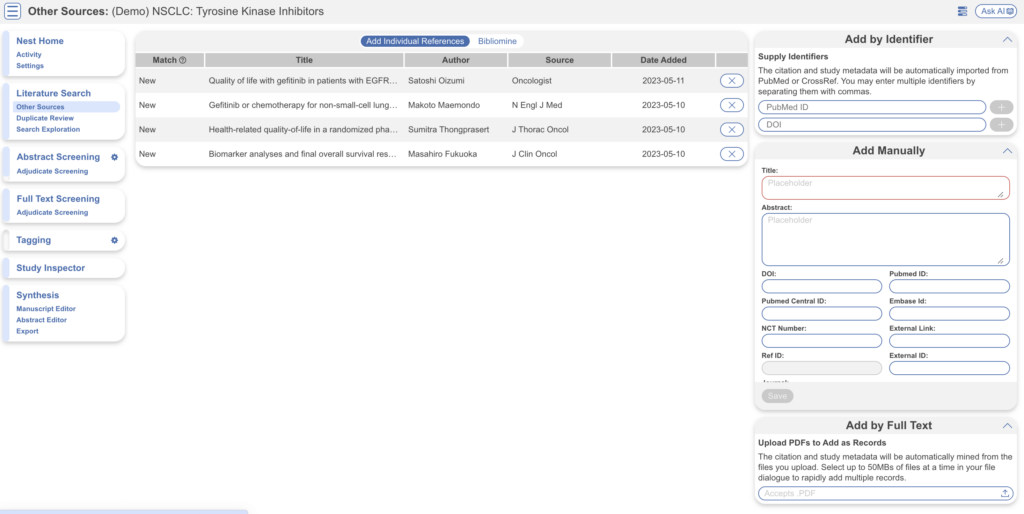
Records may be imported through other means. Click the “Other Sources” menu item under “Literature Search” to view records that were individually added as expert recommendations. 4 such studies were imported into this Nest. Try importing the DOI or PMID of your favorite study using the “Add by Identifier” form on the right of the page. You can also add manual records or upload records in bulk if you have their pdfs downloaded to your device, the software will parse out all relevant information to fill the metadata.
Note: all records uploaded to the nest by any means, will be de-duplicated. i.e. any duplicates will be automatically removed.
Search Exploration #
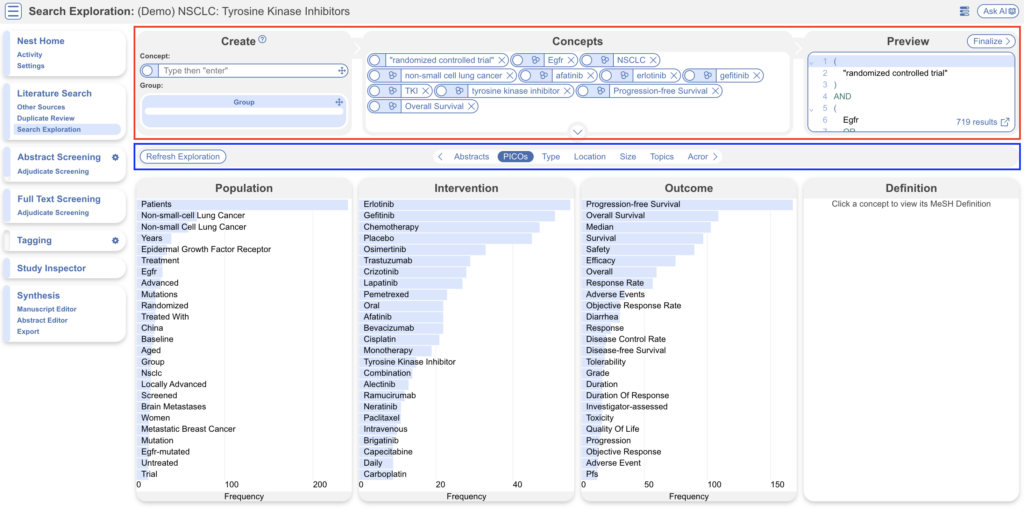
Navigate to Search Exploration see how a search query can be built and how the literature can be explored. Add concepts in the concept box, add them to groups and view the preview on the right (red). Select Refresh Exploration to explore a representation of Abstracts, PICOs, Study Types, Locations, Size, Topics, Acronyms, and Keywords.
Screening #
Abstract Screening #
Once studies are imported into a nest, they are “Screened” for relevance to the review in the Screening Module. Since this nest was setup to comply with HTA requirements, its Screening mode is set to Dual Two Pass Screening. This means two reviewers screen all abstracts first, an adjudicator decides what records are advanced, then two reviewers screen all full texts and again an adjudicator makes the final calls. First up, Abstract Screening:
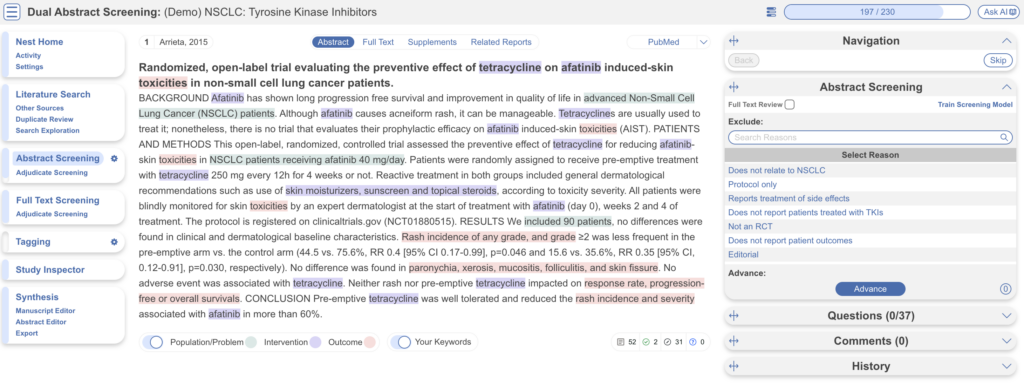
This screening module displays abstracts that have yet to be screened, allowing you to decide to advance or exclude from the next stage of full text screening. You can either click “Advance” or a specific exclusion reason from the drop-down menu. Try including a reference by clicking the include button. Exclude a reference by selecting an exclusion reason from the drop-down menu and then clicking the exclude button. You may also skip studies you aren’t yet sure about, or jump to a prior study, using the buttons under the Navigation menu. These exclusion reasons were configured under Configure Screening in the left hand menu under Abstract Screening (gear icon).
Abstract Highlighting #
Why are study abstracts so colorful? We perform machine learning-based PICO annotation of abstracts using a model derived from RobotReviewer. To turn off PICO highlighting, toggle off the slide button in the legend just beneath the abstract text.
Abstract text may also be highlighted in different colors with User Keywords, which are configured in Configure Screening or when you click on Your Keywords.
Adjudicate Abstract Screening #
After two reviewers have made decisions, a third adjudicator will adjudicate the decisions made. They would head to Adjudicate Screening in the left hand column underneath Abstract Screening.
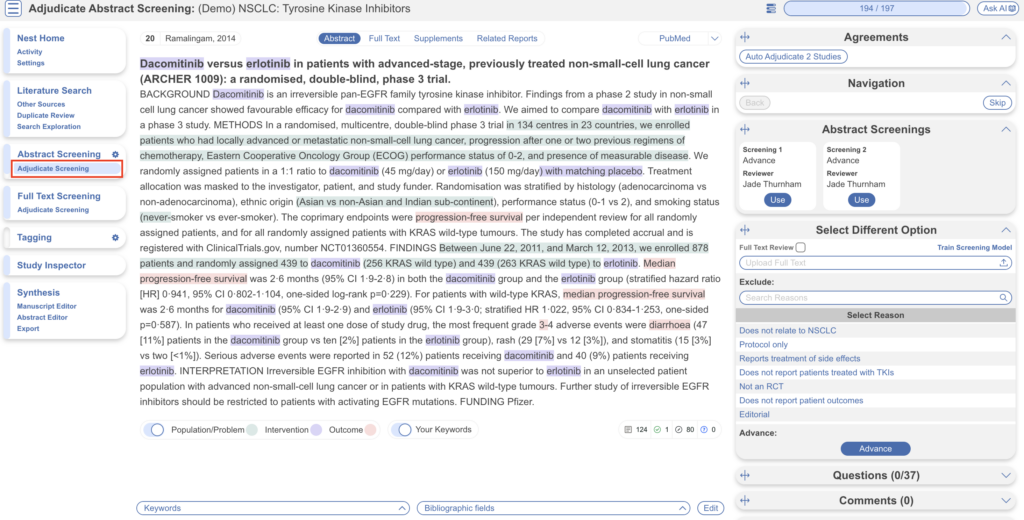
In this case, 194/197 abstracts have been screened and adjudicated. Only at this point do records advance to Full Text Screening.
Full Text Screening #
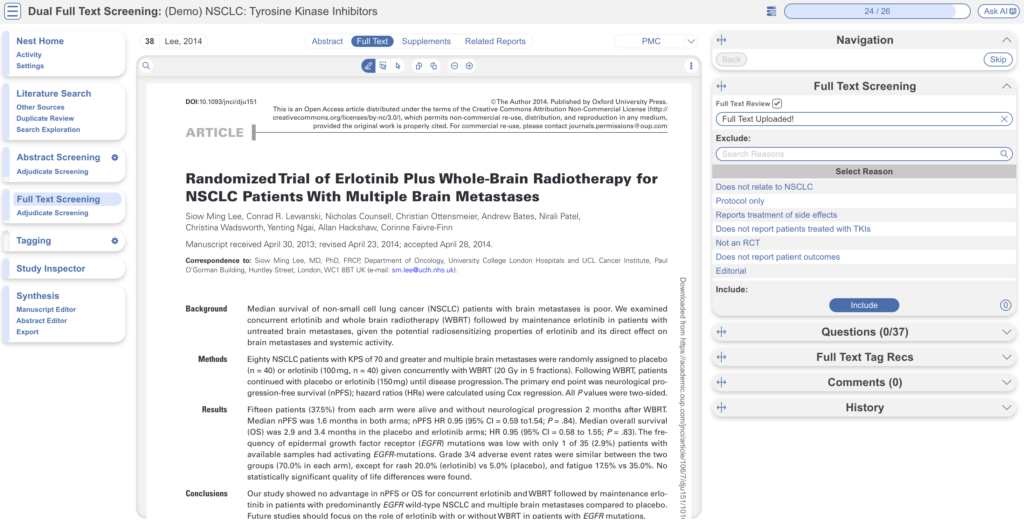
Full Text Screening (as well as adjudication) works and looks the same as Abstract Screening but you will primarily be in the Full Text tab (in red below) and you will make decisions to “Include” a study instead of “Advance” a study. Exclusion reasons stay the same.
Tagging #
The Tagging module allows you to report data from included studies in the form of “tags”. There are two modes for Tagging, Standard or Form-based. Since this nest is configured to best meet HTA requirements, it is in Form-based mode. This just means Tagging is in Q&A format for ease of collecting data. Learn more about Form-based Tagging.
Tag Hierarchy #
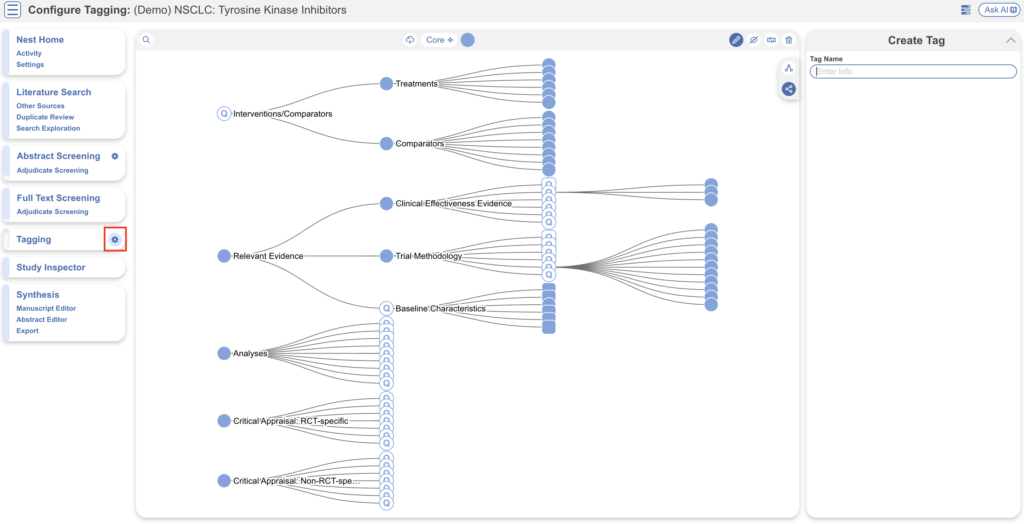
To configure the tag hierarchy, select the gear icon next to the Tagging menu item. Tag hierarchies consist of tags (visualized as points) and relationships between them (visualized as connecting lines). The tag hierarchy in this review consists of Interventions/Comparators (in purple on the left), Relevant Evidence, Analyses, and Critical Appraisals – these tags at the highest level are called “root” tags, everything below them are “child” tags.
Hierarchies should be created and read as a series of “is a” relationships. For example, “Adverse Event” is a “Outcome”, “Septic Shock” is a “Adverse Event”. Hover around the hierarchy to explore tags and read off the “is a” relationships as you go. Tags with a Q are configured as questions, click on these to explore question types.
Tagging Module #
Inside the Tagging module, tags may be applied to studies, by answering questions indicating that a concept is relevant to a study.
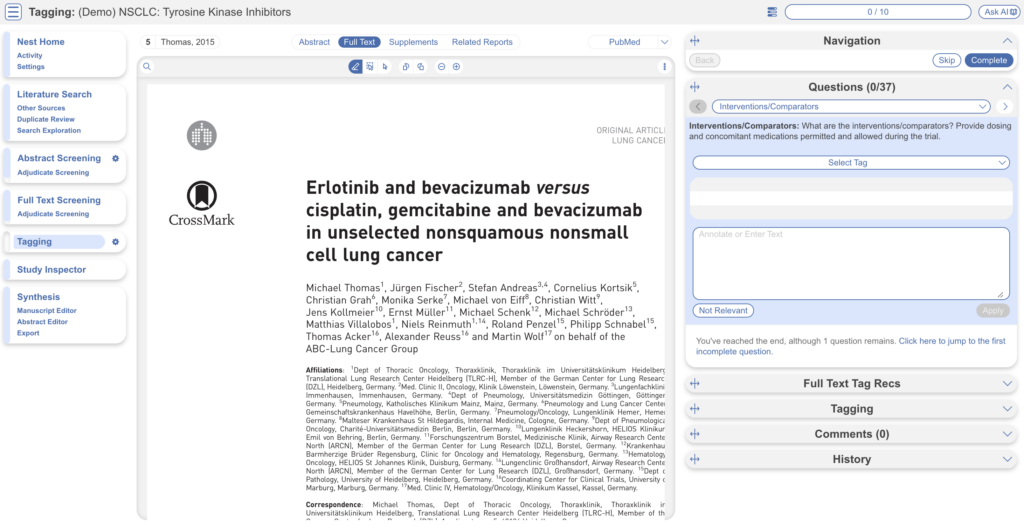
In the Tagging form, go through question by question and select tags from the dropdown menu or fill out tables then click Apply Tag; it should now appear in the Tagging Table.
Click a row in the Tagging table that has a non-empty excerpt column to view past applied tags and their “excerpts”, which user-entered pieces of text or tables, typically extracted from the manuscript, supporting the tag.
Study Inspector #
Study Inspector is the tool in AutoLit for reviewing and searching your past extracted data. Each row in Study Inspector is a study, and columns may be user-selected in the upper left dropdown menu. Studies may be searched into the table by creating Filters. Filters may be created using the Add Filter dropdown menu, but oftentimes the typeahead search bar is fastest.
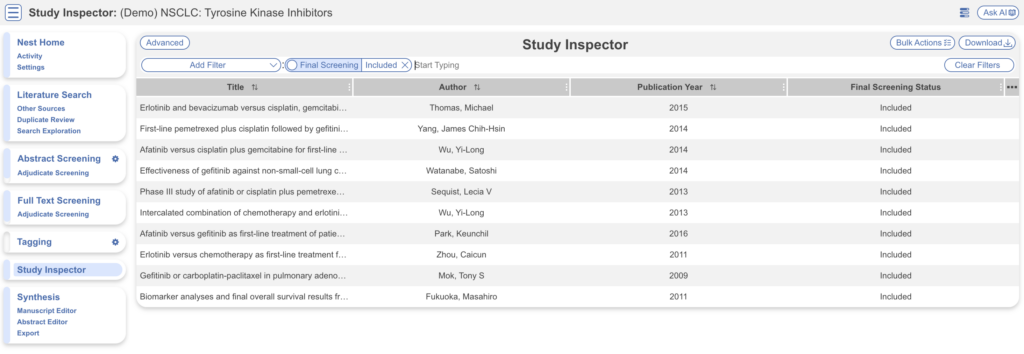
Synthesis #
At this point, we’ve reviewed all the evidence gathered in AutoLit for the Non Small Cell Lung Cancer: Tyrosine kinase inhibitors Nest. Now let’s navigate to Synthesis Home to draw some conclusions from our evidence, by clicking the Synthesis menu heading.
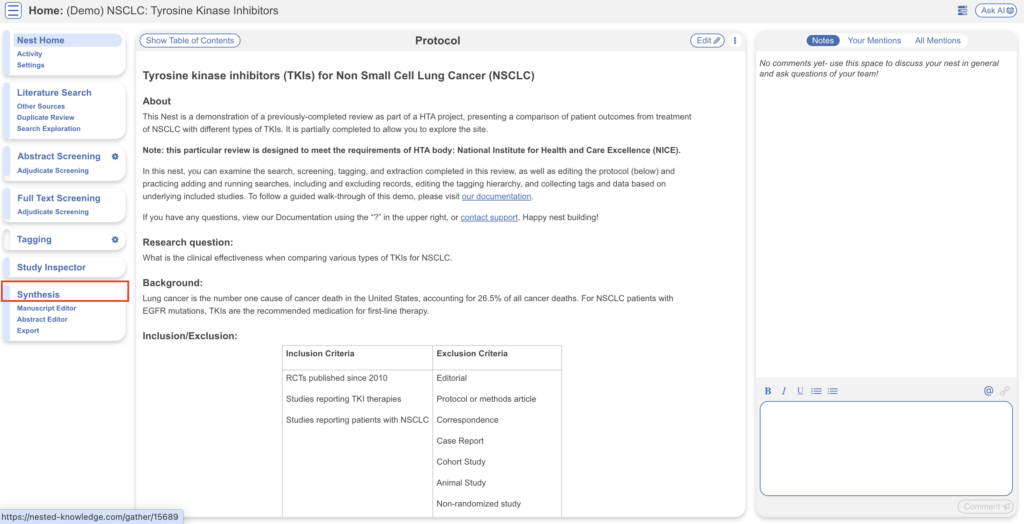
The Synthesis offerings for this demo include Qualitative Synthesis, Manuscript & PRISMA.
PRISMA #
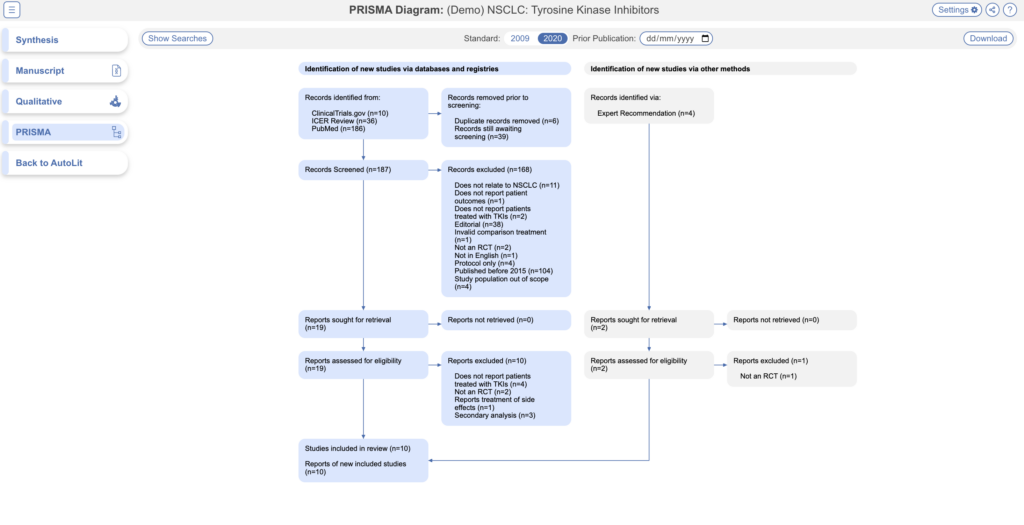
Click the PRISMA button in the bottom left of the page to view a PRISMA 2020 flow diagram. The diagram is auto-populated based on searches imported and studies screened in AutoLit.
Qualitative Synthesis #
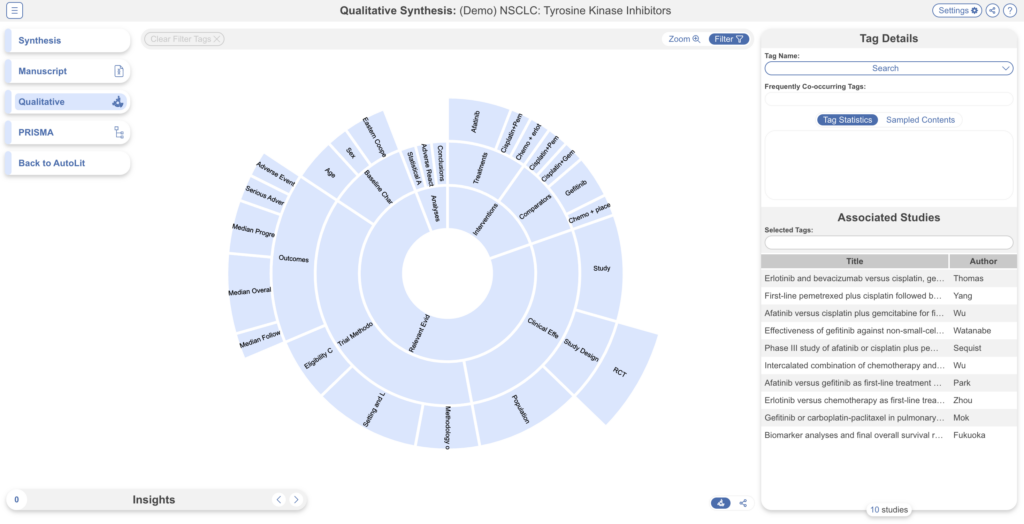
Navigate back to Synthesis Home and click the Qualitative Synthesis box. Qualitative Synthesis (QLS) displays data gathered in the Tagging Module. Each slice in the sunburst diagram is a tag. Its width corresponds to how frequently it was applied. Its distance from the center corresponds to its depth in the hierearchy (how many “is a” relationships are between it and its root tag). Click a slice to filter studies displayed to those where the tag was applied. Clicking multiple slices filters to studies with all the selected tags applied. The rightmost bar shows relevant studies (bottom) and some data about the tag (top), like its frequency, excerpts, and tags that were commonly applied with the selected tag.
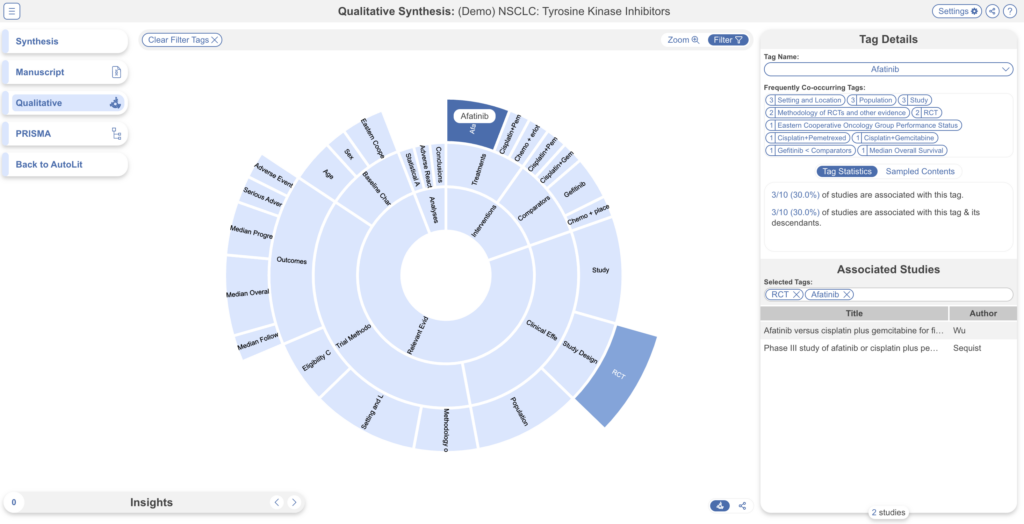
In this tag selection, we see that studies reported as a RCT and reporting the intervention: Afatinib were reported as outcomes in 2 of 10 included studies. Click the rows of the study table to take a deep dive into the extracted data.
Optional: Meta-Analytical Extraction & Critical Appraisal #
By default, the Meta-analytical Extraction and Critical Appraisal modules are off. This particular review did not include a full meta-analysis but if you wish to explore this module, you may turn it on in this demo nest under Settings –> MA Extraction, toggle on:

Then ensure Quantitative Synthesis is shown as an output too:

Since this module is work-intensive, it is optional; numerical data can simply be collected during the Tagging stage.
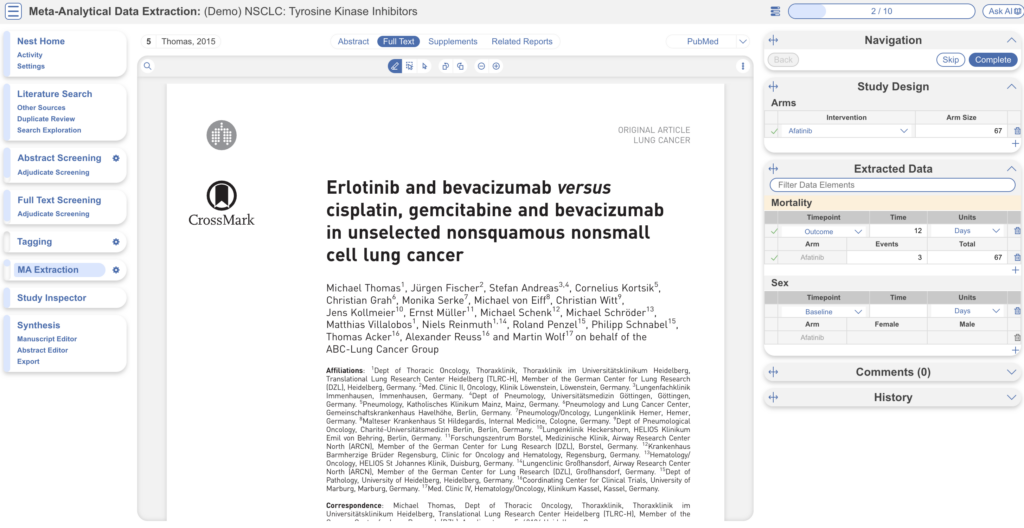
You may then navigate to the MA Extraction module to explore how numerical data is extracted in the nest in AutoLit.
Explore Quantitative Synthesis #
Navigate to Quantitative Synthesis for auto-generated Summary, Distribution and NMA outputs.

Closing Remarks #
You’ve now seen how a review in compliance with HTA guidelines may be completed & shared with the Nested Knowledge platform. We encourage you to head back to AutoLit and explore the variety of configuration options, and ever-growing feature set we didn’t get to cover here. If you’re feeling ambitious, start your own Nest from scratch!
Use this documentation to guide you through more complex topics, and as always, please reach out to our support team via email and make requests on Nolt.

