There are several methods to export contents from your nest depending on your desired export.
Use this Export page for included studies:
- Custom Table Export
- Useful for Tables you’d like to build and save but do not wish to display directly on Synthesis/Dashboards outputs
- CER Builder
- Generate and Export Smart Insights to Word Doc
Use Download from Inspector for bulk contents of all studies:
- Study metadata (CSV or RIS Files)
- Screening decisions
- Tags & Tag Contents
- Meta-Analytical Extracted Data
- Critical Appraisal
- All Full Text PDFs
Alternatively, use Table Cards in Dashboard Editor to create updatable tables that stay housed and updated in the Dashboard outputs space. The functionality is the same so see below for instructions on Custom Table Creation.
Custom Table Export #
Custom Tables enable you to choose which bibliographic data, tags, and data elements (if applicable) you would like to export in your included studies only. Use this option if:
- You want to choose the table type between tables of Study-level data, Study-Arm-level data, or Intervention-level data (i.e., in order to choose what the rows represent).
- You want to filter to only a subset of the studies in your nest.
- You are seeking to define exactly which columns should be presented to mimic spreadsheets of your own.
Throughout the Custom Table build, the page presents a Preview; use this Preview to understand the structure that your exported table will have after you are finished!
1. Navigate to Export #
Under Synthesis, click “Export”
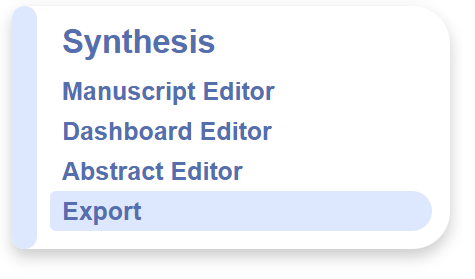
It should already be opened to Custom Tables; if you navigate away, click the “Custom Tables” toggle to return to this page.
2. Choose Type of Table #
By default, the Name selected is “Study” but there are several types to choose from. Click on the drop-down menu under “Name” in order to choose whether you would like a table showing elements from the study as a whole, the various study arms in each study (placebo, intervention groups, etc.), across all interventions or a tag frequency table.

Study Table #
Export a Study Table if you want one row per study, and extracted data from Tagging as individual columns (recommended for most constructed tables).
Select “Study” in the drop-down, and proceed to add Filters (tags or related reports) and Columns– you will be able to choose among Bibliographic data, Tag data, or Study Size. You may also sort the listed studies by bibliographic data, MA extracted data or related report data. This will create a table where each row represents a single study and each header is either a bibliographic attribute or a tag.
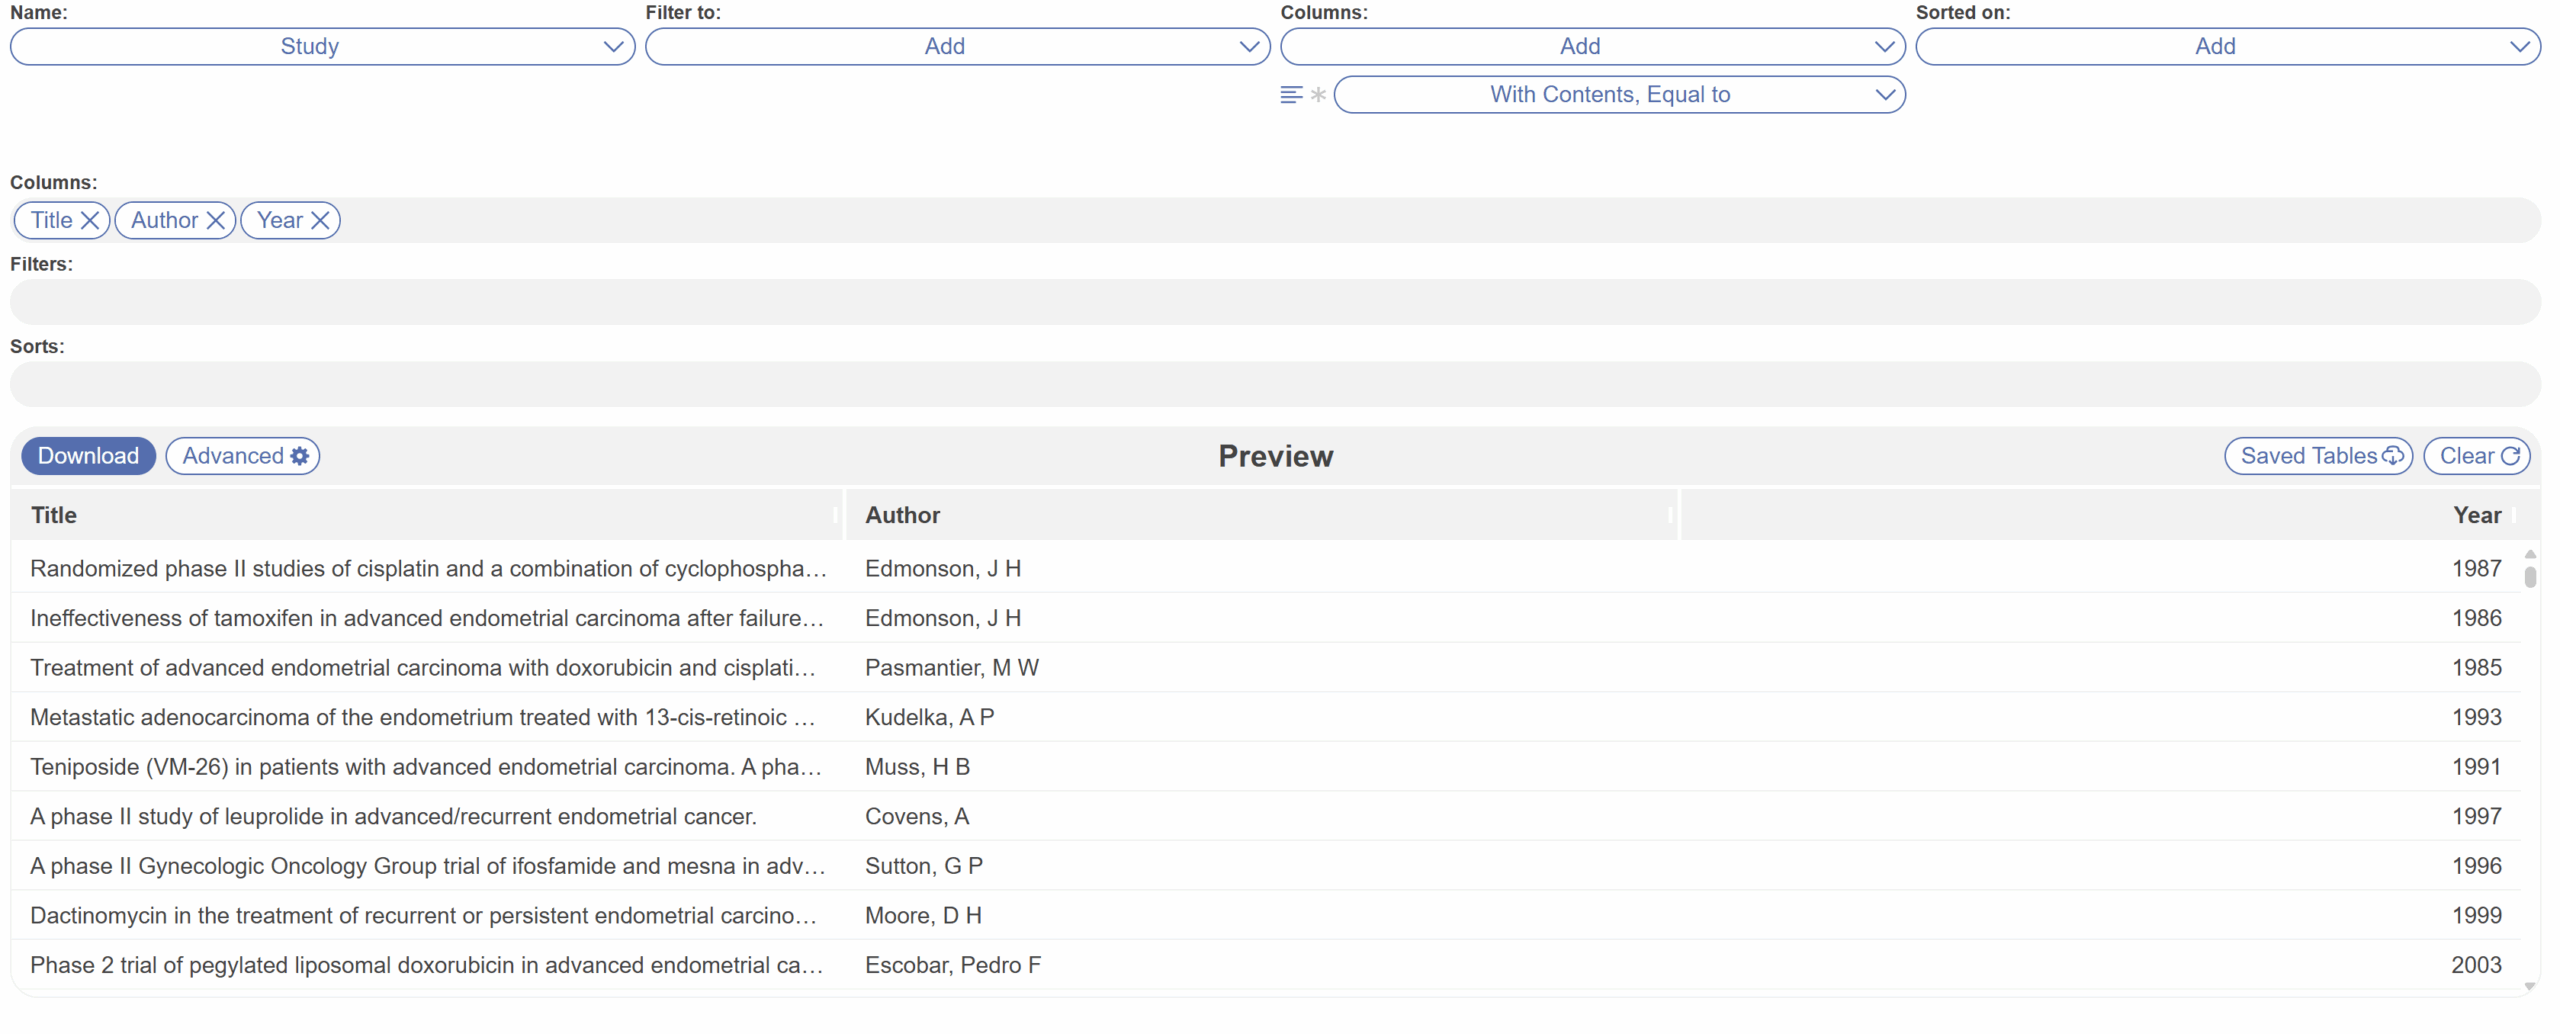
Table of Study Arms #
Export a Table of Study Arms if you have completed MA Extraction and want each arm in each study to have its own row. This is the most similar table type to the Export All Data option below.
This is the most common export type for completing statistical analysis, since it is the only table type that can list the exact data elements from the underlying studies. It will create a table where each row is an arm (so a study, as shown by the boxes, may be split into multiple rows below), and can have bibliographic, tag, or data element columns:
Table of Interventions #
Export a Table of Interventions if you have completed MA Extraction and want to summarize all data at the level of Interventions. This is the most similar table type to the initial Summary view of Quantitative Synthesis.
This table type will have each Intervention in a row , and the only options for rows will be summaries of the Data Elements for each Intervention :
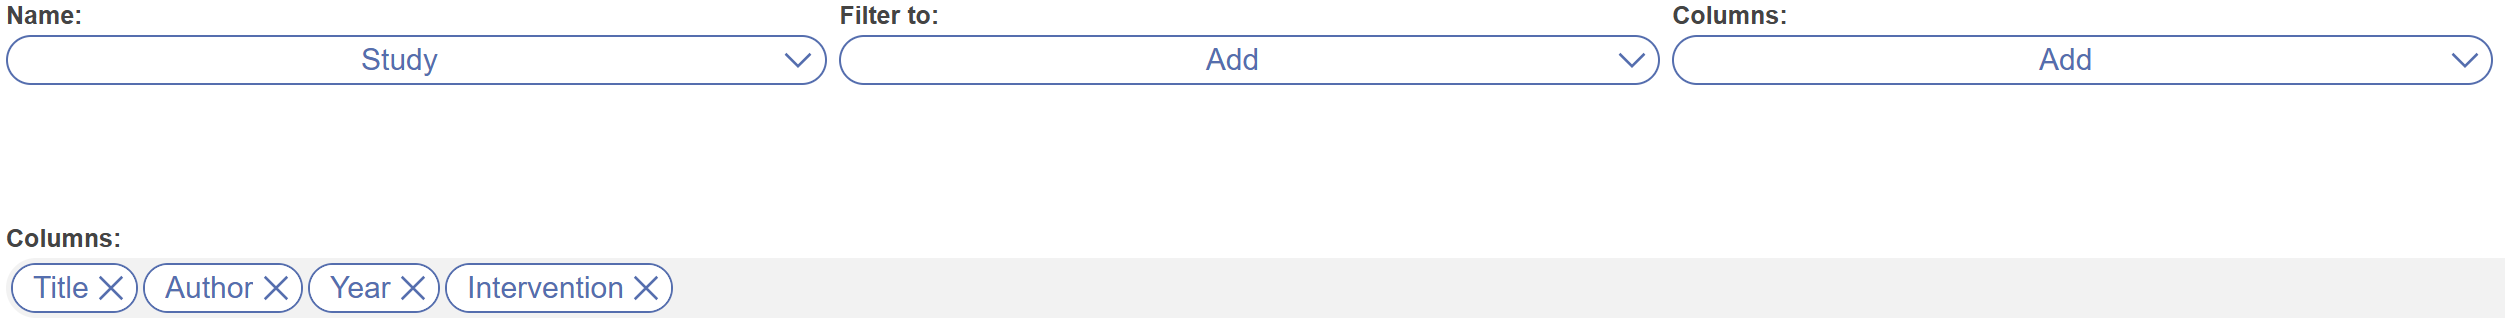
Table of Tags #
Selecting Table of Tags is a specialized option; instead of exporting underlying study information, this exports your tagging hierarchy with basic information about the use of each tag.
If you select this option, you will export a table where each row is a tag, and you will additionally be able to note:
- The Tag Description
- The “Depth” of that tag, representing where it is in the hierarchy (0 = Root Tag, 1 = right below Root Tag, etc.)
- If that tag was configured as a Data Element
- The frequency of the use of that Exact Tag
- The Recursive Frequency of that tag, representing how commonly that tag OR any of its children were used
Note: A Study Arm or Interventions table can only be generated if they were assigned during Meta-Analytical Extraction. Otherwise, selecting either of these will produce a blank table. Instead use a “Study” table and select the appropriate tags if data extraction was only performed in Tagging.
3. Filter (Optional) #
If you want to export only the data from a subset of the studies in the nest, use the “Filter To” dropdown after selecting “Table of …”. This will work differently based on the Table Type you selected above:
- Study: you can filter by bibliographic data (publication date and time of retrieval), by applied tags, related report family and related report type.
- Study Arms: you can filter by bibliographic data (publication date and time of retrieval), by applied tags, related report family, related report type, by study arms that have a certain Intervention, and/or a certain Data Element collected for them.
- Interventions: you can filter to studies that have a specific Intervention.
- Tags: you can filter to studies that have a Tag at or below a certain level.
4. Add Columns #
Once you have selected the type of Table you are exporting and applied any relevant filters, you can customize what columns will be presented in your exported Table.
Depending on Table Type, you can select:
- Bibliographic Data: Citation, Title, Year, Publication Date, Author, Authors, DOI, PubMed ID, a Link to the article, among others.
- Related Report Families can be identified as one of the pieces of Bibliographic data, with either the custom name or Author, Year of the Primary report.
- To add all citation information in one cell, select “Citation” from the Attribute drop-down. All citations or references in Nested Knowledge are presented in (JAMA format).
- Meta-Analytical Extraction: Study Size: The total number of patients in a Study.
- Arm Data: includes Intervention and Arm Size (MA Extraction only)
- Tag: The tag names and tag text excerpts at or below a given tag or exact tag.
- Intervention: The Intervention applied to an entire cohort or to a Study Arm.
- Study/Arm Size: The total number of patients in a Study.
- Data Element: The exact quantitative data associated with a given Study Arm or cohort. Note: Categorical Data Elements cannot be exported in this table structure due to their large column sizes (MA Extraction only)
- Tag MetaData: Add the name, description, depth, and data element type.
- Tag Statistics: Add Exact and/or Recursive Frequency.
Adding Tag Columns #
There are few options for how tags can be displayed in custom tables. Select the left-align icon if you wish to display in the below cells any contents/annotation associated with the selected tags: “With Contents”. Unselect if you do not want to display contents/annotations. Select the asterisk when selecting a parent tag, and you wish to display the child tags in the below cells: “At or Below”. Unselect when selecting a child tag.
Examples #
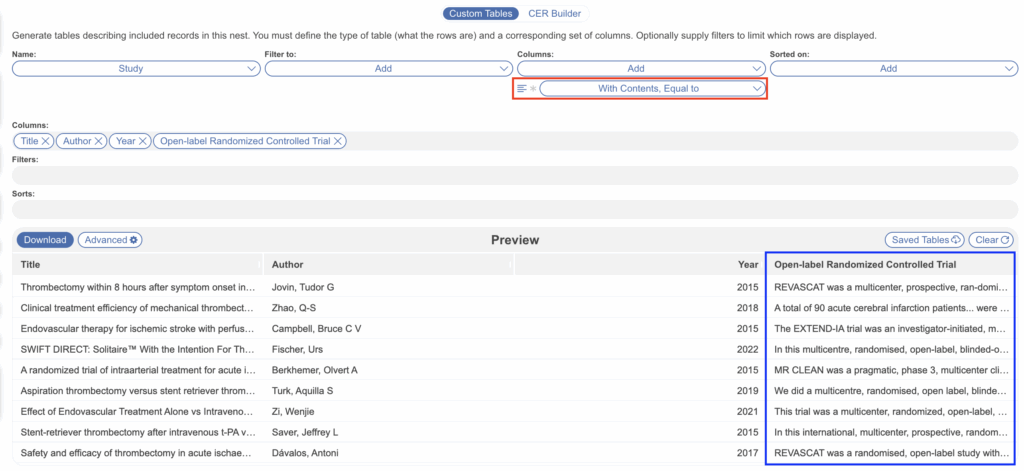
- With Contents, Equal to
- Default setting: Used for child tags where you wish to display the child Tag Name as the column header, and the annotation/contents in the cells below.
- Indicated by the selected left-align icon, disabled asterisk (red)
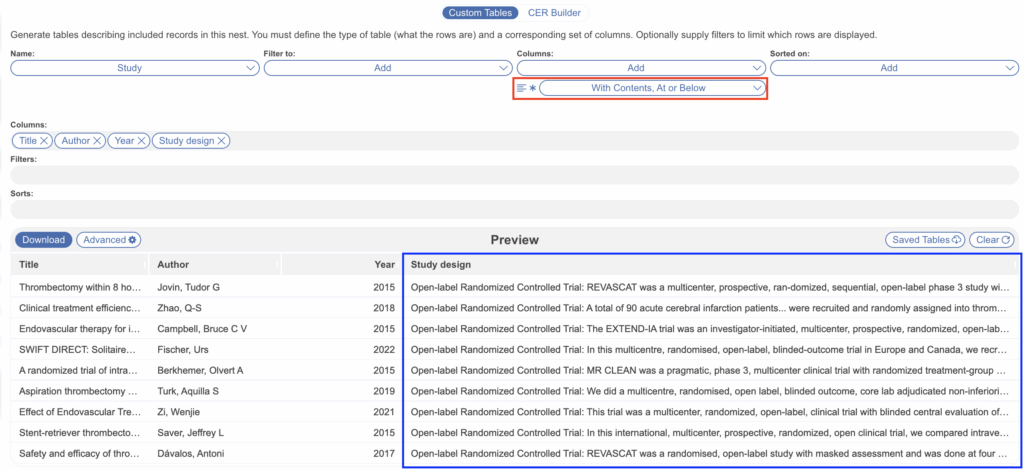
- In the below example, “Open-label Randomized Controlled Trial” was selected with this setting so it’s displayed as the column header and ONLY its annotation/contents is displayed below in the preview (blue)
- With Contents, At or Below
- Used for selecting parent tags where you wish to display the parent Tag Name as the column header, and all the applied child tags AND their annotation/contents in the cells below.
- Indicated by the selected left-align icon and the selected asterisk (red)
- In the below example, “Study Design” was selected so it’s displayed as the column header. It is the parent tag of “Open-label RCT” and the child tags have annotations so they are included.
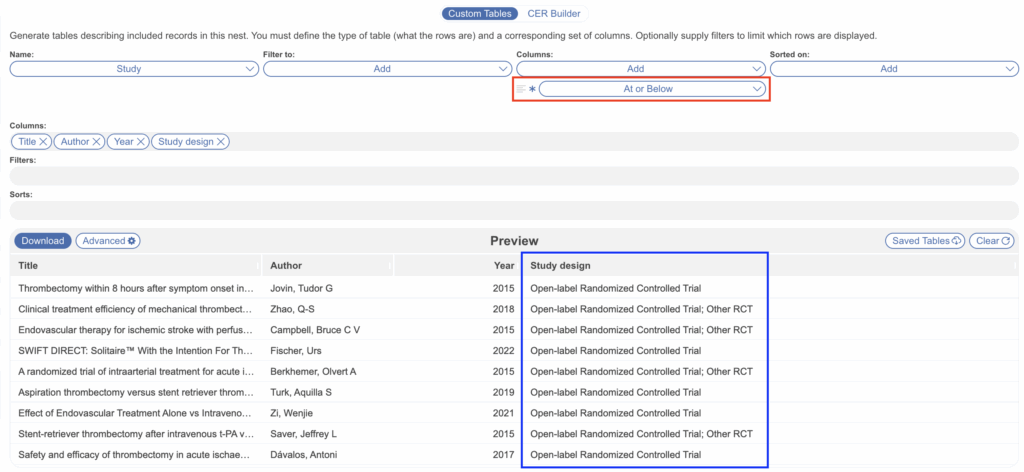
- No Contents, At or Below
- Used for selecting parent tags where you wish to display the parent Tag Name as the column header, and all the applied child tags WITHOUT their annotation/contents in the cells below.
- Indicated by the disabled left-align icon and the selected asterisk (red)
- In the below example, “Study Design” was selected so it’s displayed as the column header. It is the parent tag of “Open-label RCT” and “Other RCT, as listed in the table preview without any annotations/contents.
- No Contents, Equal to
- Used for selecting child tags where you wish to display the child Tag Name as the column header, but with NO annotation or contents below. Instead, only the tag name will be displayed in the applicable rows.
- Indicated by both disabled icons (red)
- In the below example, “Open-label RCT” was selected so it’s displayed as the column header, and ONLY the tag name is displayed in the cells where applicable, no annotation.
Combining Tag Table Columns #
If you have configured and extracted data in tag tables, you can add individual tags to your custom table or add all table contents. To do so, under the columns dropdown select “Exact Tag” and you will see both options. Tags with an associated table will have a table icon next to them allowing you to pick and choose or select “All Table Contents” at the top.
When multiple tables are added, the tables can be combined in one of two ways:
- Concatenation (default): tables are simply displayed alongside each other with no combination of matching column headers
- Joins: tables are displayed such that columns with matching headers may be combined
Concatenation #
This is the default table combination, no action is required. Tables are displayed exactly as filled out as individual tables alongside one another, and additional rows for a single study are created as necessary. Any matching column headers are not joined automatically. For example, below, you can see each table has a column for interventions, which is where they could be combined. Since Concatenate is selected, they remain as is.
Joins #
If you wish to combine matching column headers, e.g. by Intervention or a particular Endpoint, when selecting Combine Tables: “Join” (red), NK attempts to join columns that share similar names to reduce duplicate columns. In the below example, since the two table share an “Intervention” group, they were automatically joined.
Since the joins are automatically assigned, they can be incorrect. If so, you can manually unjoin them by clicking the icon between tag tables listed (circled in red below) and clicking “X” on the incorrect joining (circled in blue below). Here you can also manually join other column names as appropriate.
5. Sort Studies #
You may wish to sort the order of studies presented in the table and can sort by bibliographic data, meta-analytical extraction (if applicable) or by assigned related report families.
6. Reorder Columns #
If you wish to change the order of columns presented, simply drag and drop the column pills:
The column order will change accordingly.
Saving and Exporting your Table #
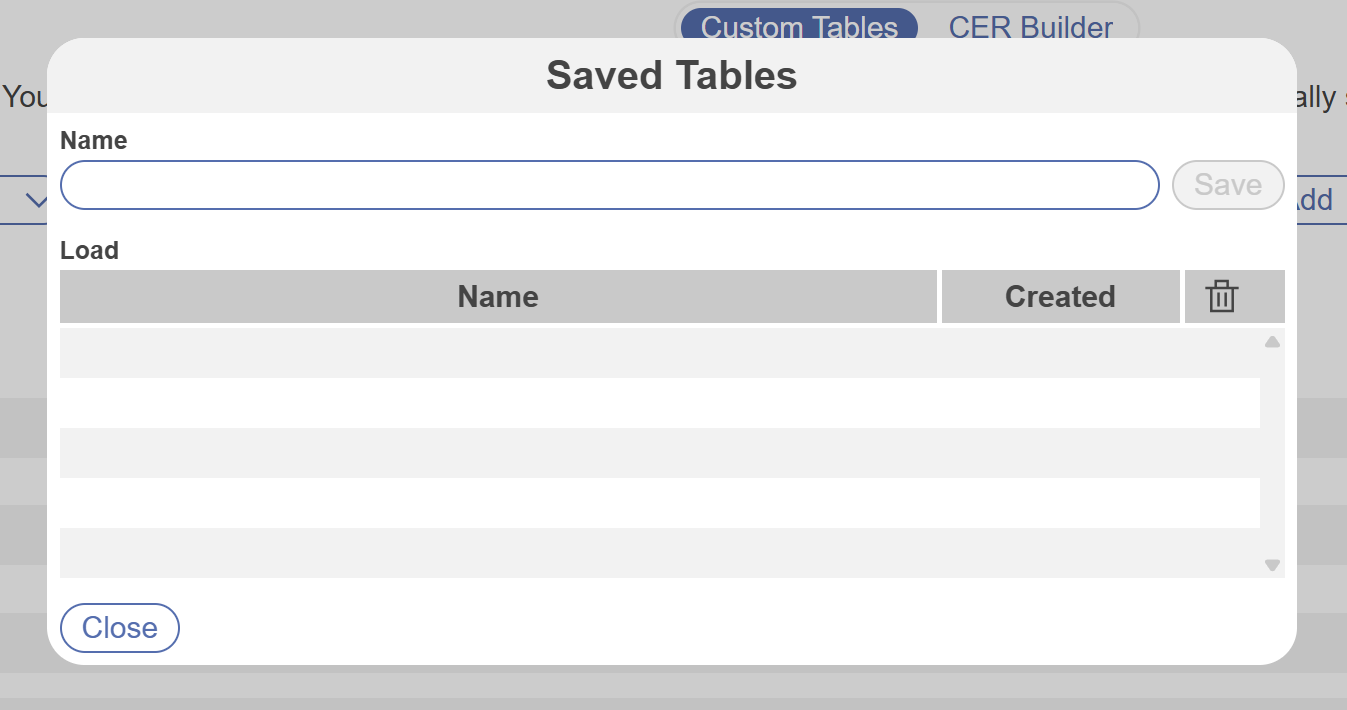
Saved Tables #
Once you have spent time building out your table, you may wish to save it for access again later as when you refresh the page, the table builder also refreshes.

Add a name and save. Now, when you return to the Export page, navigate to Saved Tables to retrieve your saved table by selecting the name. It will auto-populate the table.
Advanced Settings #
Before downloading, you may wish to explore the advanced setting. By default, when you add multiple tag columns to your table that are organized under separate root tags in the hierarchy, the data under each root tag will be exported into separate sheets within your workbook. Each sheet will be titled with the root tag. This can be helpful to organize large datasets. If you’d prefer all columns to be encompassed in a single sheet, simply uncheck the box.

When your table is customized with the settings of your choice, click Download.
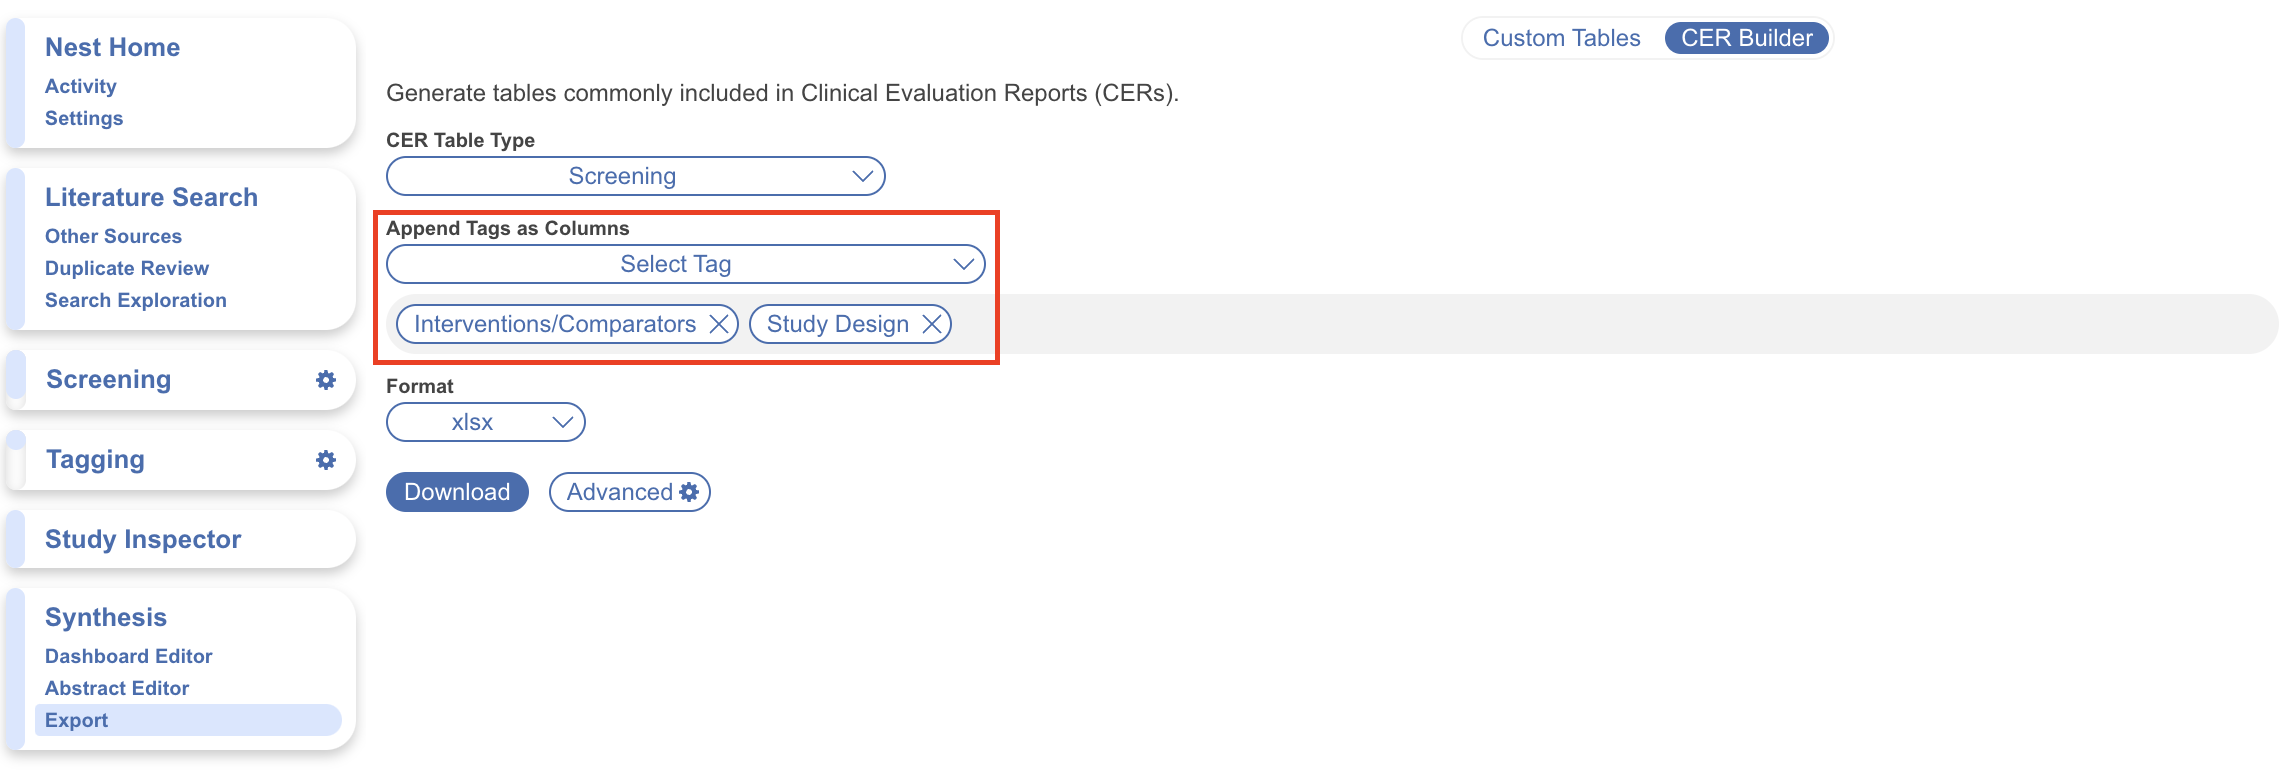
CER-specific Exports #
Nested Knowledge offers export of certain data required by the EU MDR 2.7.1 Rev 4 as part of the Clinical Evaluation Report submission process.
Accessing the CER Export page #
To access the CER Export page, select Export from the AutoLit menu, and then in the resulting page, toggle to “CER Builder.”
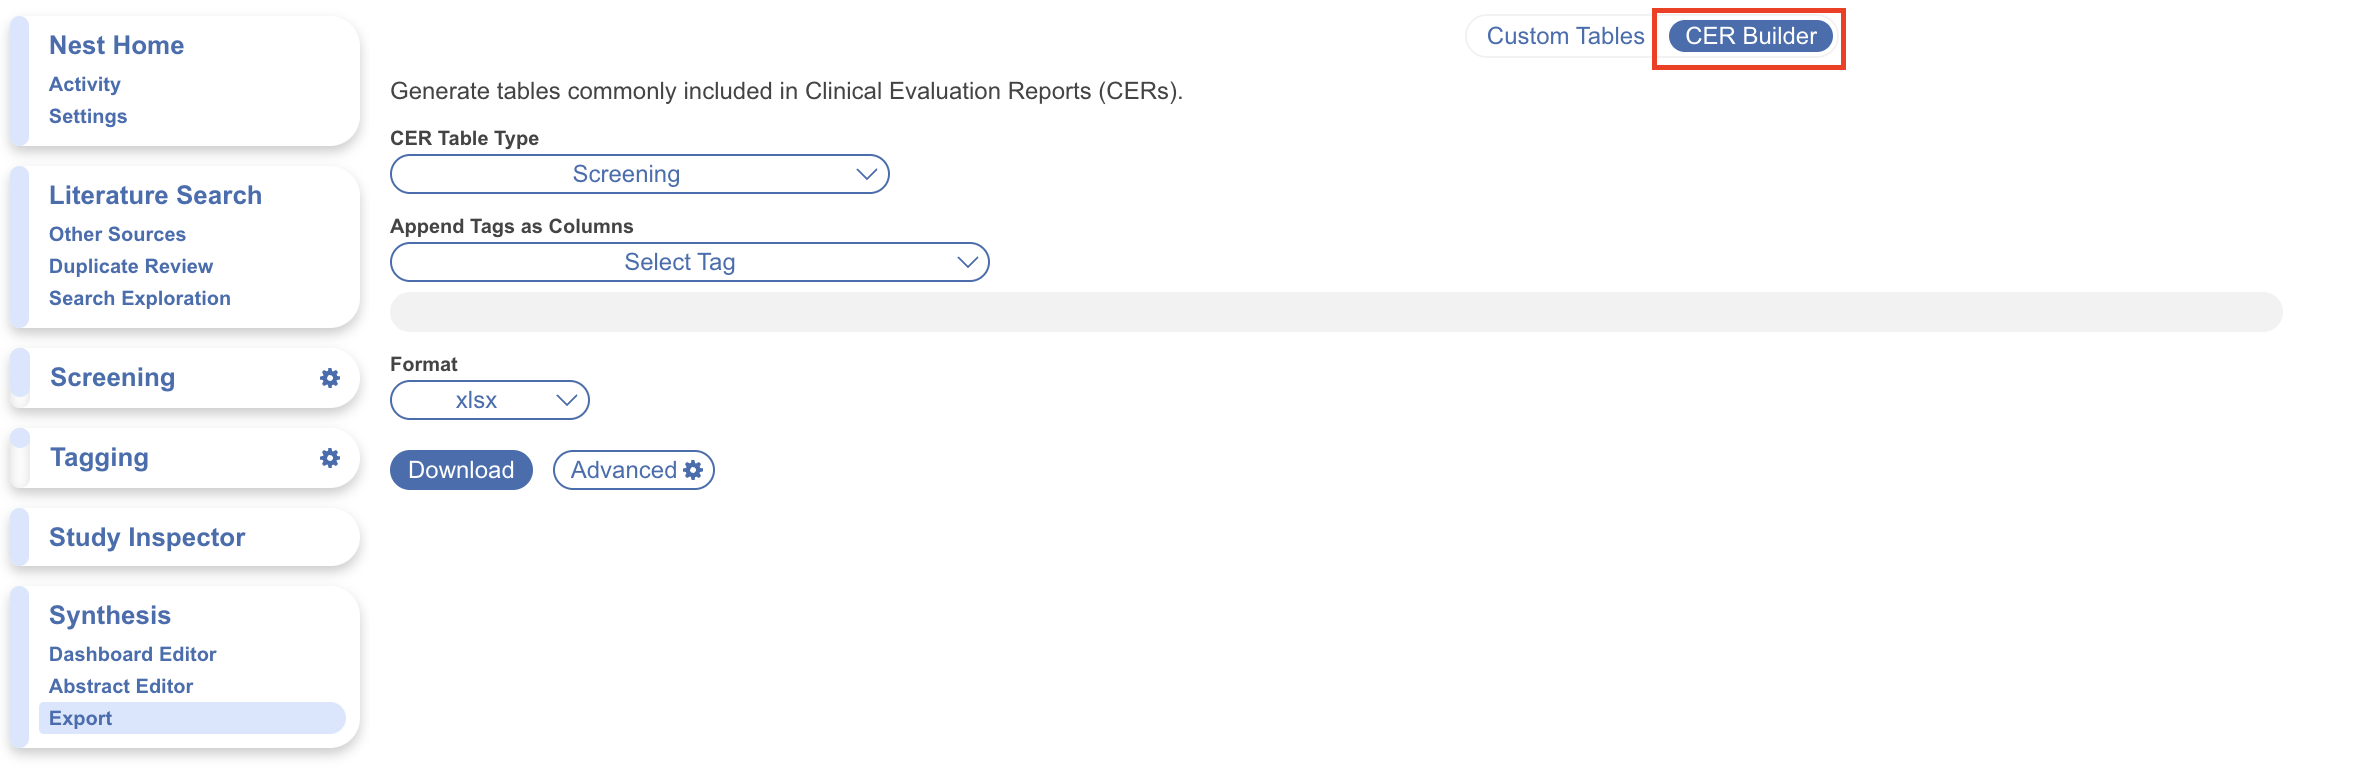
Exporting Documents and Data #
In the CER Builder, you have the options of exporting your Literature Search or your Screening activities.
1. Literature Search Export #
To export a record of the Search Engines you used, alongside specific queries used, the number of total records returned, duplicates found and the number included and excluded from each search (as well as all studies that were added individually), select “Literature Search” from the drop-down.
Then, choose whether to export as a .docx or a .xlsx, and select “Download.” See below for an example. Searches are listed in chronological order from top to bottom by when they were first ran in your nest. The duplicate column refers to the number of duplicates found in the corresponding search, compared to the studies already in the nest and therefore returned by previous searches.
2. Screening Export #
To export a record of all studies Screened in your nest, with full citation information and links to full texts, as well as the Screening status and (if excluded) the Exclusion Reason, select “Screening” from the drop-down. You can also choose to include tags as columns within your table.
For the CER Screening Table specifically, by default, the columns are separated out into Authors, Title, and Year. If you wish to consolidate these columns into a singular “Reference” column, navigate to “Advanced” settings, and check “Consolidate citation columns” prior to Download.
Then, choose whether to export as a .docx or a .xlsx, and select “Download.”
Export All Data or Export RIS Files #
These functions can be accessed in Download from Inspector; see here for specific instructions for exporting RIS files.
Smart Insights #
From this page you can also generate and download Smart Insights. These are AI summaries of the key extracted data in your nest with claims and cited studies to support them.