Nested Knowledge creates a convenient PRISMA flowchart for publication use. It will summarize the number of articles that were screened and fulfilled the search criteria.
What is PRISMA? #
PRISMA is a set of guidelines for systematic review and meta-analysis released by the EQUATOR Network.
These guidelines cover the entire review process, and the PRISMA checklist can be used to ensure completion of key review activities. One key requirement is the generation of a PRISMA Chart, which shows the flow of records from their initial search/import through to presentation.
Navigating PRISMA in Synthesis #
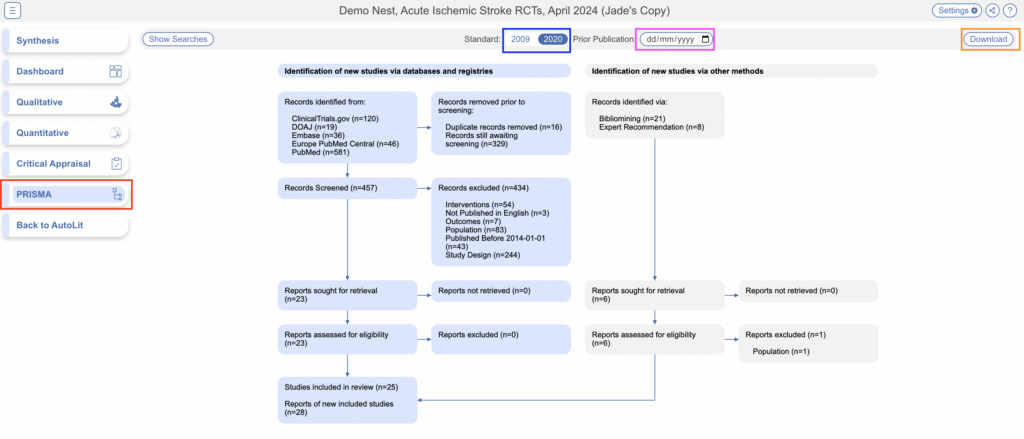
To get to the PRISMA chart, from Synthesis, click “PRISMA” in the bottom left of the page (red).
Once there, you can:
- View all searches in the nest (top left);
- Toggle between PRISMA 2009 and PRISMA 2020 depending on your review needs (blue).
- Adjust the date range for the PRISMA chart. Entering a date here will restrict the PRISMA chart to show only records that were present in the nest at that point in time (pink).
- Download a version of the PRISMA chart (right side of the page, orange). To download, after clicking this button,
- Select the image type you are interested in from: PNG, TIFF, or JPEG; and
- Select the Resolution/DPI you need for the image (max: 1200 DPI).

Share or Download #
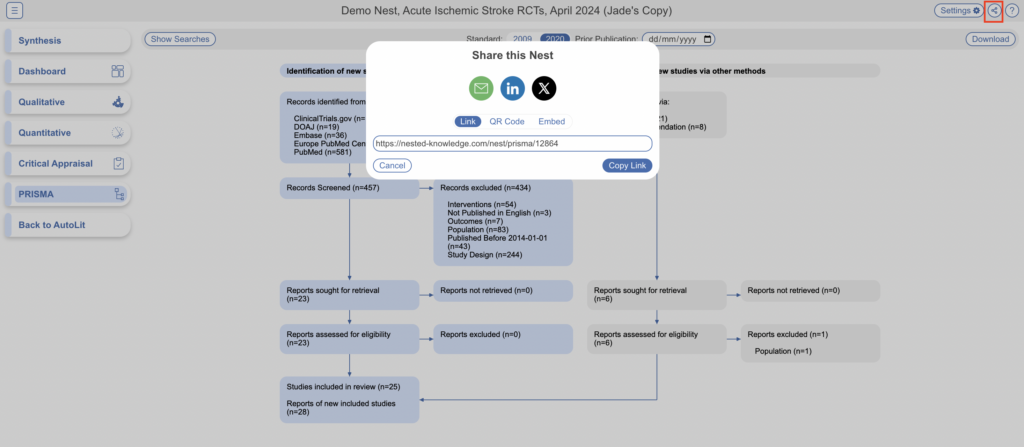
Similar to other items in Synthesis, you can share the PRISMA page by clicking on the share icon in the top right. You have the choice of sharing via a link or downloading a QR code.

Filtering Synthesis #
You can also apply broader filters to view specific sets of studies via the Settings button in the top right. Learn more about Synthesis Filters.
PRISMA Chart Contents #
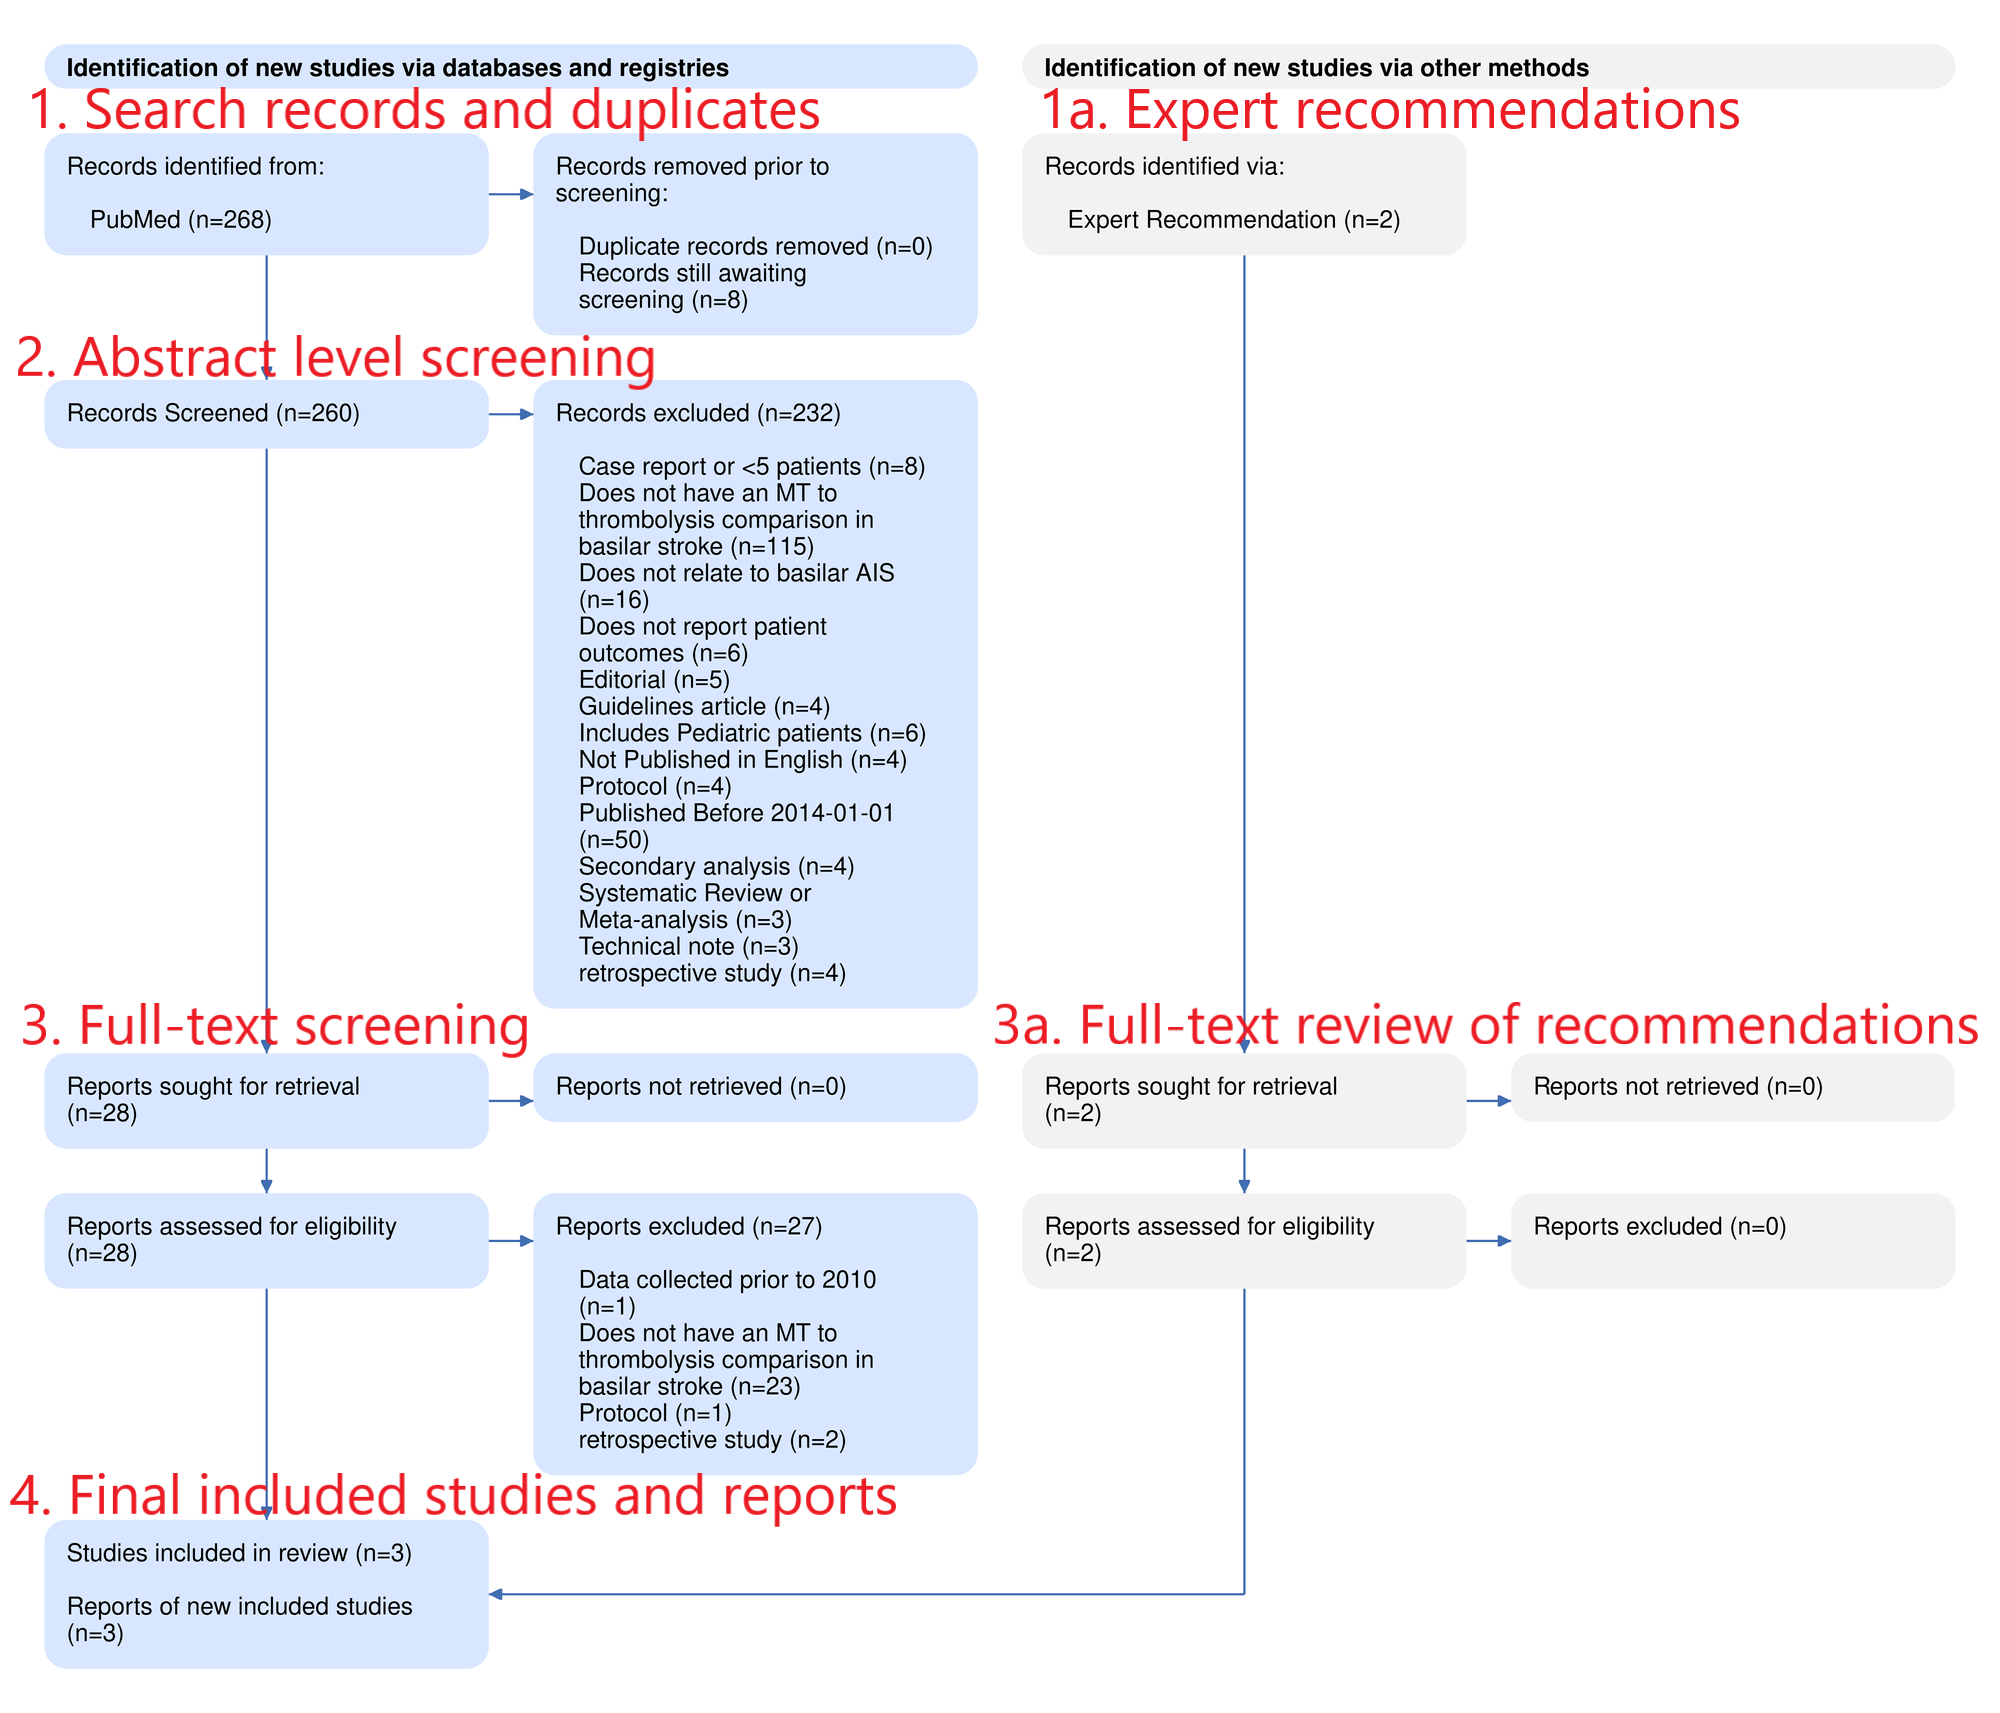
The Nested Knowledge software automatically generates a PRISMA chart that meets the 2020 PRISMA guidelines. This chart displays the flow of records from Search → Final Included Studies/Reports in the following manner:

- Search & Duplicates: This row displays the number of records found, and the number of records that were removed as duplicates. If you imported RIS files, they are recorded as Searches reflecting the query & date you entered when you imported those files.
- Expert Recommendations: This parallel study flow represents all records identified outside of searches. Specifically, all individually-added and bibliomined records are shown here.
- Abstract Screening: This row displays the number of records screened, and number excluded (with a breakout of exclusion reasons), based on only Title and Abstract. This only applies to searched records, not Expert Additions.
- Note: If Two-Pass Screening is selected, this row represents step 1 in that process. If Two-Pass Screening is not selected, this row represents all studies that were excluded without checking the “Full Text Review” button.
- Full Text Import & Screening: The next two rows represent the number of studies that proceeded to Full Text screening. First, the number of full texts sought & number successfully found are shown; the right column displays the number of records that were excluded for the specific “No Full Text Found” reason. Second, the number of records excluded based on full text review (with a breakout of exclusion reasons) is displayed.
- Full Texts – Recommendations: All screening decisions for Expert Additions are reflected in this step.
- Final Included Studies & Reports: This final box shows the number of Included Studies, meaning the number of underlying patient populations whose data were collected, and the number of Included Reports, meaning the number of publications detailing these populations.
- Note: While in most cases the number of studies and reports may be equivalent, these can differ if there is overlap in the reporting of patient populations due to multiple publications containing data on the same patient population.

