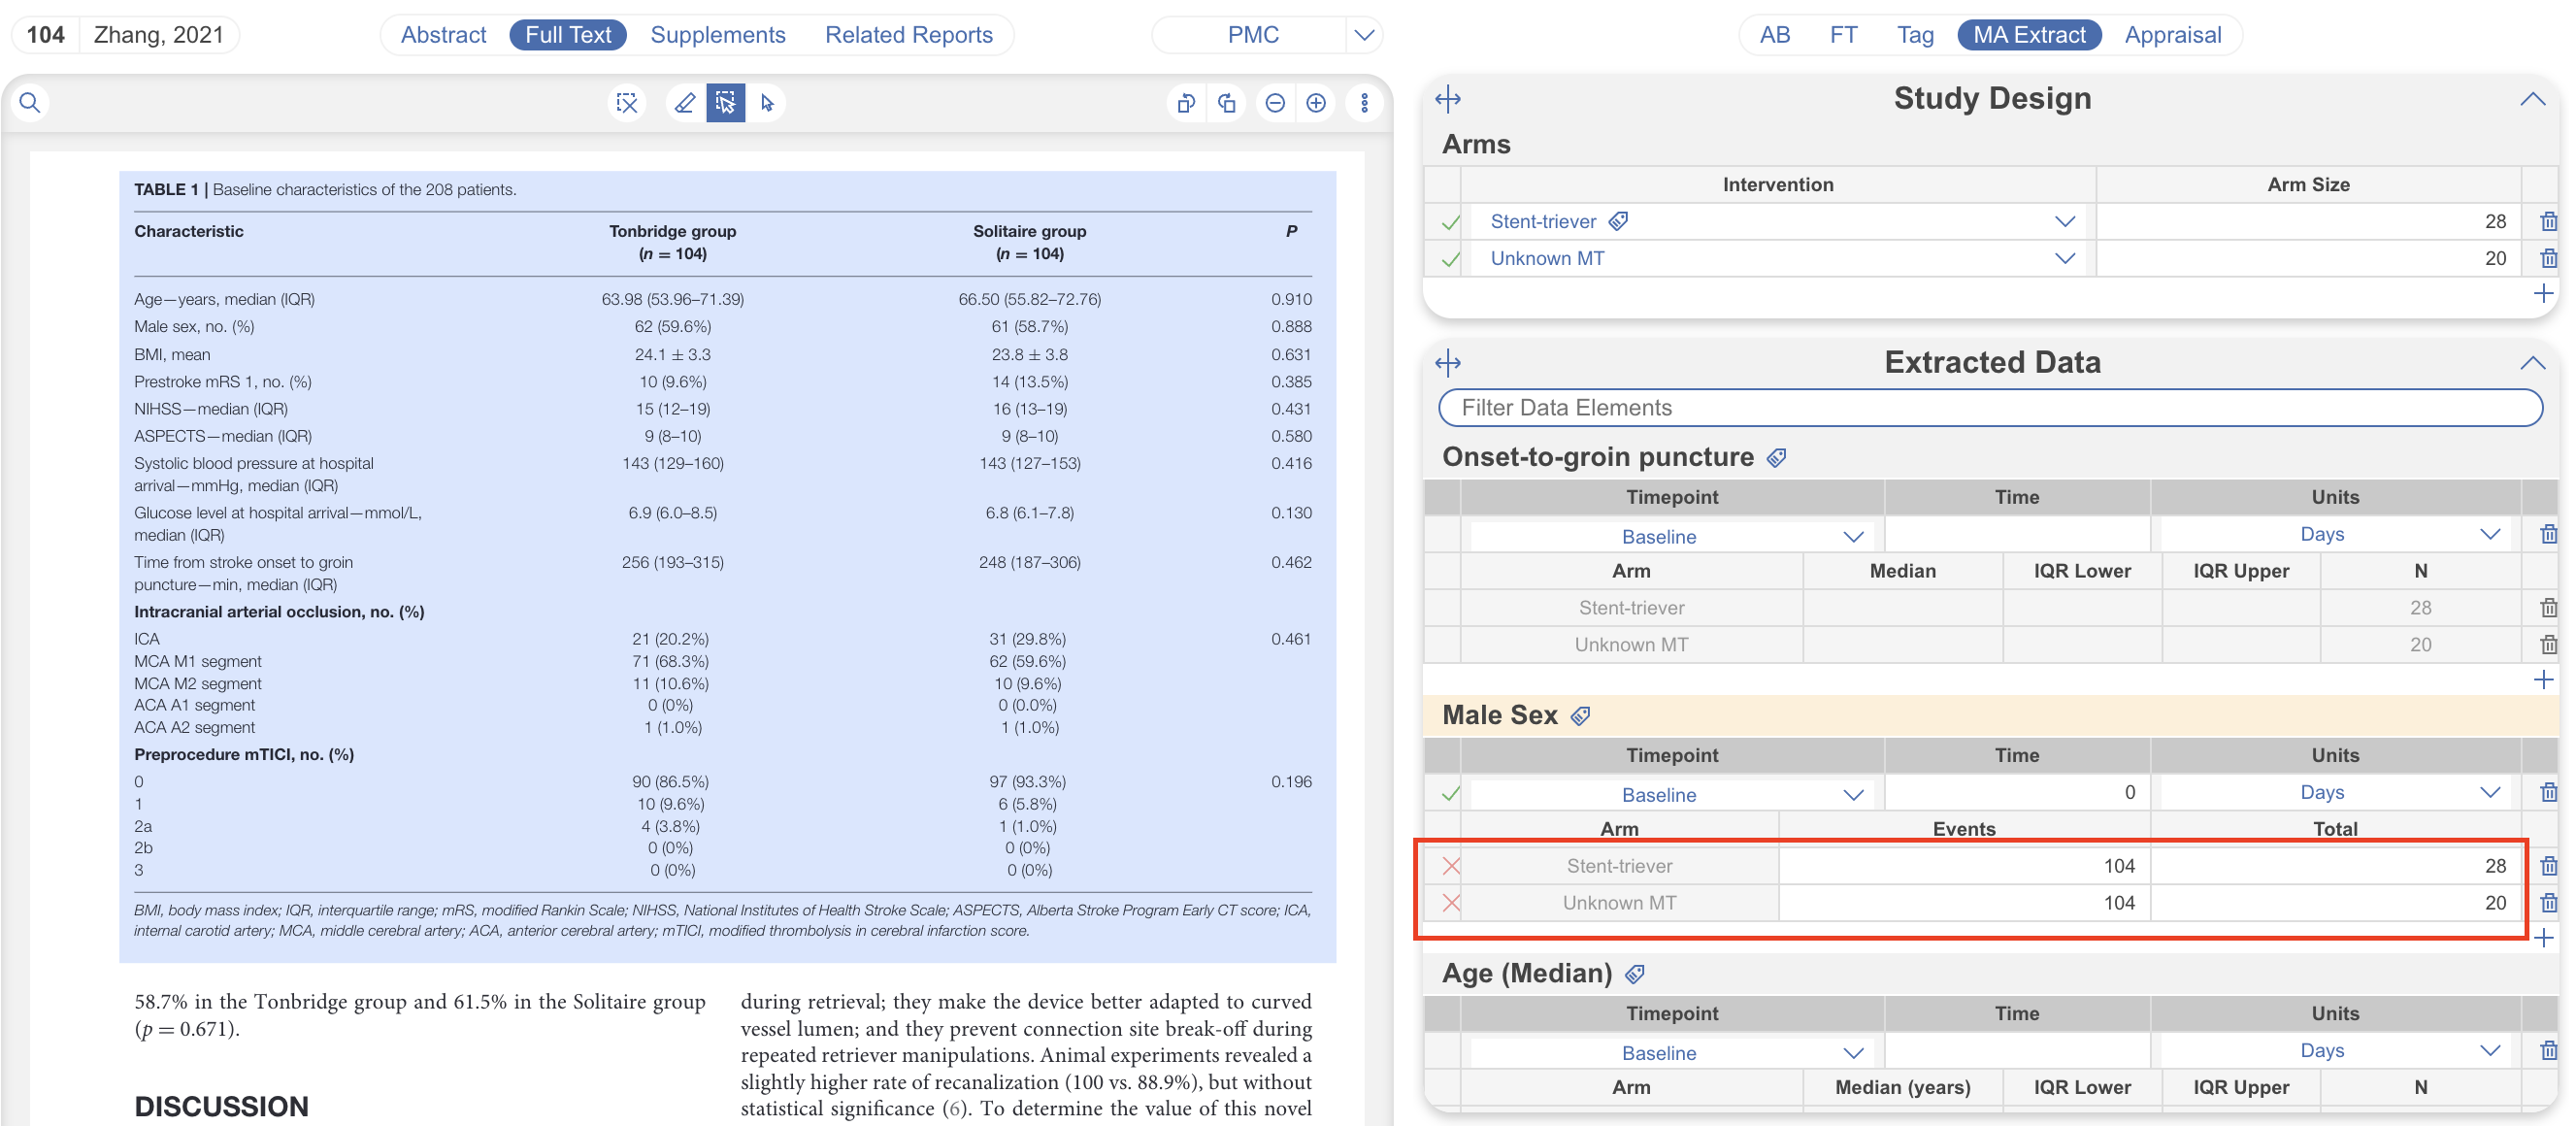
Once you have configured your Interventions and Data Elements, you are ready to extract data from all included studies in the nest.
Steps for MA Extraction: #
1. Navigate to Extraction #
Select “MA Extraction” from the menu:

Alternatively, you can Extract MA data from the “MA Extract” tab in Inspector. See here for details on how to get to the Study Modal.
2. Add Study Arms #
Study Arms represent the patient groups you plan to extract.
2a. Add Rows #
To add study arms and identify the Intervention used for each arm, click the “+” button (red circle) in the Study Arms section of the Study Design panel (upper right). Add one Arm for every patient group from the study you plan to extract (blue). A tag icon will appear next to an Intervention if it is tagged in the study (orange).

2b. Identify Interventions #
Then, determine what Intervention the study investigated and then find that Intervention using the Intervention drop down menu (see above, blue).
2c. Identify Arm Sizes #
Next, determine how many participants were included in the study and put that number in the “Arm Size” box. Add a new Study Arm for every patient group you want to extract separately. The status box will be a red cross until an arm size is inputted.

Once inputted, the data elements will load underneath.
3. Extract the Meta-Analytical Data: #
Once you have finished establishing the Study Arms, you are ready to extract the data from the underlying study. The first step in doing so, for each Data Element, is establishing the Measurement Timepoint for each Data Element.
3a. Select Measurement Timepoints #
Each Data Element has one Timepoint presented by default; select whether this timepoint will be:
- Baseline: Usually reported at the start of a study. One Baseline timepoint per Data Element will be displayed on Synthesis.
- Outcome: Reported at a designated follow-up period. One Outcome timepoint per Data Element will be displayed on Synthesis.
- Other: Any additional timepoint reported that is of interest. Any number of Other timepoints may be created and saved in AutoLit, but “Other” timepoints will not be presented on Synthesis.
When you designate a timepoint as “Baseline” or “Outcome”, you are designating that its data should be pooled with other studies’ data. This means that the Measurement Timepoint you designate as “Outcome”, for instance, in each study, must be similar to the “Outcome” timepoint designated in all other studies in that nest.
3b. Enter Time and Units for each Measurement Timepoint #
For each Timepoint, enter the follow-up period with the appropriate unit of time (Days, Weeks, etc.). For Baseline Timepoints, this will typically be 0 days. Once you add a timepoint, the data element will be highlighted orange.
3c. Extract the MA Data for each Measurement Timepoint #
Read through the study and extract the relevant data scoped to each specific Timepoint. You can also select the tag icon which will auto-scroll you within the pdf to the attached annotation applied at the Tagging stage.
Adding Additional Annotations #
In addition to viewing the annotations applied at the Tagging stage, you may also add further annotations at the MA Extraction stage. To do this, if applicable clear the current selection. Then choose if you’d like to select text or area annotation (red) and make your pdf selection. Then select “Annotation” next to the applicable data element (pink) and select “Add New.” This will also be available to review again after completion in Study Inspector. Then the annotation is then captured (as below) and can be selected anytime to auto-scroll back to the associated annotation.
3d. Changes to Total Population / Loss to Follow-up #
If the total population for any Data Element differs from the total population you reported for the Study Arm as a whole, ensure that you edit this information in the “Total” column for that individual Data Element.
3f. How to use the “Status” symbols #
As with Interventions, watch for the red Xs that appear under “Status”. This means something is wrong with the data (missing information, non-numerical information, or other error).

If any of your data elements have a red X, DO NOT hit “Complete”. You will need to figure out the problem and fix it before hitting “Complete” or risk losing the data from that row.
4. Complete Data Extraction #
Once you have input all of the relevant and correct data AND all of the timepoints for each Data Element you extracted have a green check mark, you can hit complete and move onto the next study!

