Nested Knowledge automatically generates your Domain Distribution and Traffic Light diagrams if you complete Critical Appraisal through our AutoLit Critical Appraisal module.
Navigating to Critical Appraisal Visuals #
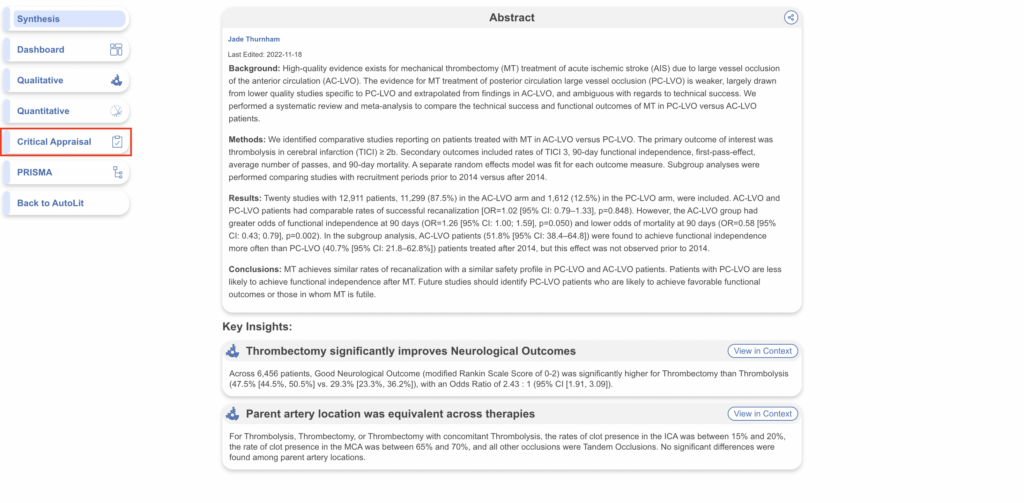
Critical Appraisal visuals are found on the Synthesis page, at the bottom of the Contributors column:

Domain Distribution Diagram #
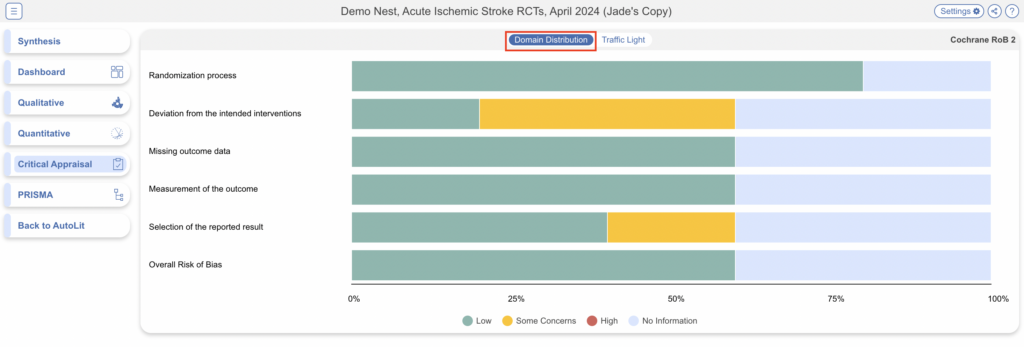
Once you have navigated to the visuals, you can see the Domain Distribution plots. The categories presented will depend on the Critical Appraisal survey you completed; in the visual below, see the Cochrane RoB2 tool’s outputs for Internal Validity and Overall Assessment of risk. These represent global assessments across a nest, rather than study-level outputs.

Traffic Light Diagram #
Traffic Light diagrams represent study-by-study assessments, where each column is a study-level assessment of the category in question (here, the Internal Validity and Overall Assessment from Cochrane RoB2 tool’s survey.

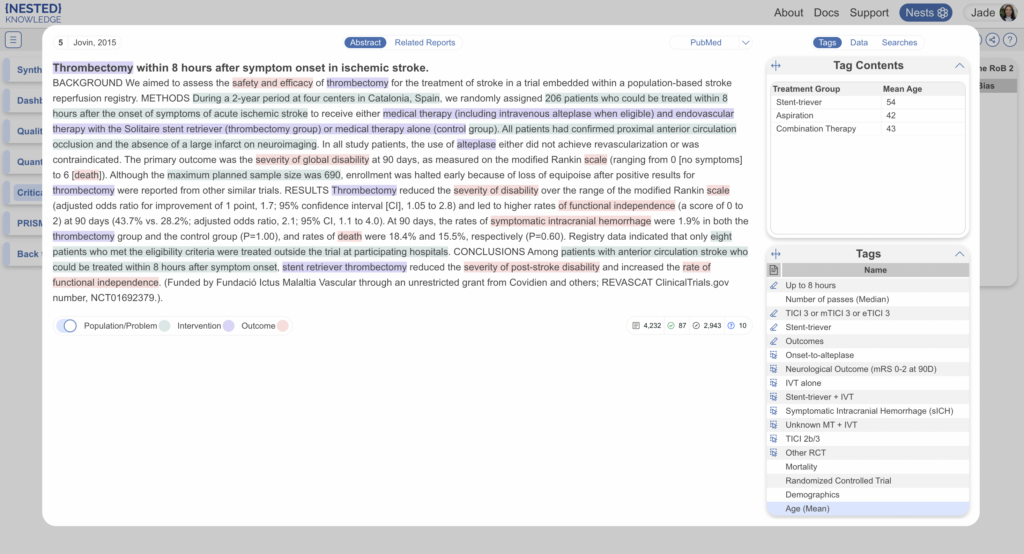
The study Author/Year (red box) is clickable, alternatively select the icons underneath each category, which opens the Study Modal showing the abstract, data, tags, and search history for the study in question:

Filtering Synthesis #
You can also apply broader filters to view specific sets of studies via the Settings button in the top right. Learn more about Synthesis Filters.
Share or Download #
Similar to QLS and QNS, you can share your Critical Appraisal page by clicking on the share icon in the top right. You have the choice of sharing via a link or downloading a QR code.


