PRISMA Flow Diagram: How publications ‘flow’ through the updated PRISMA 2020 process and chart

July 22, 2022
This article gives an overview of the PRISMA Flow Diagram (as generated in Synthesis) and the implications of the PRISMA 2020 changes to the PRISMA Diagram.
The PRISMA Flow Diagram has become a standard part of any systematic review or meta-analysis, and with good reason– it is the most widely accepted method to show the process by which the studies included in a review were included (or excluded). It also shows the different possible steps of a review, different potential sources (from PubMed to ‘expert recommendations’), and the exact reasons you set up to differentiate the wheat from the chaff among the studies you examined.
This blog will go through some common questions about PRISMA Diagrams and also go step-by-step through how to read a PRISMA Diagram. Let’s jump right in!
Why do journals require me to show my work?
If your systematic review is published, the hope is that it will become a resource for your readers to find comprehensive evidence on your research question. That means that failing to show where you sourced the information breaks the chain of evidence from source->review->reader. Therefore, you need to track the underlying studies you searched and extracted information from in order to keep the scientific community informed on your methods and findings.
Table of Contents
Why do I also need to track all the studies I excluded? Aren’t they irrelevant?
Not quite! A systematic review is not only a collection of data from relevant studies, it is also the endpoint of a search and screening process that separates the wheat from the chaff. In any situation where you screen, there is a chance for false positives (i.e., studies that were included but were in fact irrelevant) and false negatives (studies that were relevant, but excluded). If you don’t track your searches and all studies that result from it, there will be no way for you or your readers to check whether any false positives or negatives occurred.
Furthermore, when you set up your screening process, you probably defined ‘Exclusion Reasons’ based on your best judgment of whether they matched your research question. However, these Exclusion Reasons define the boundary between ‘part of a comprehensive answer to the question’ and ‘irrelevant,’ and there is always the potential for disagreement about where to draw those lines.
Next, we need to express logical relationships between these properly enclosed search phrases with their synonyms and acronyms via boolean operators.
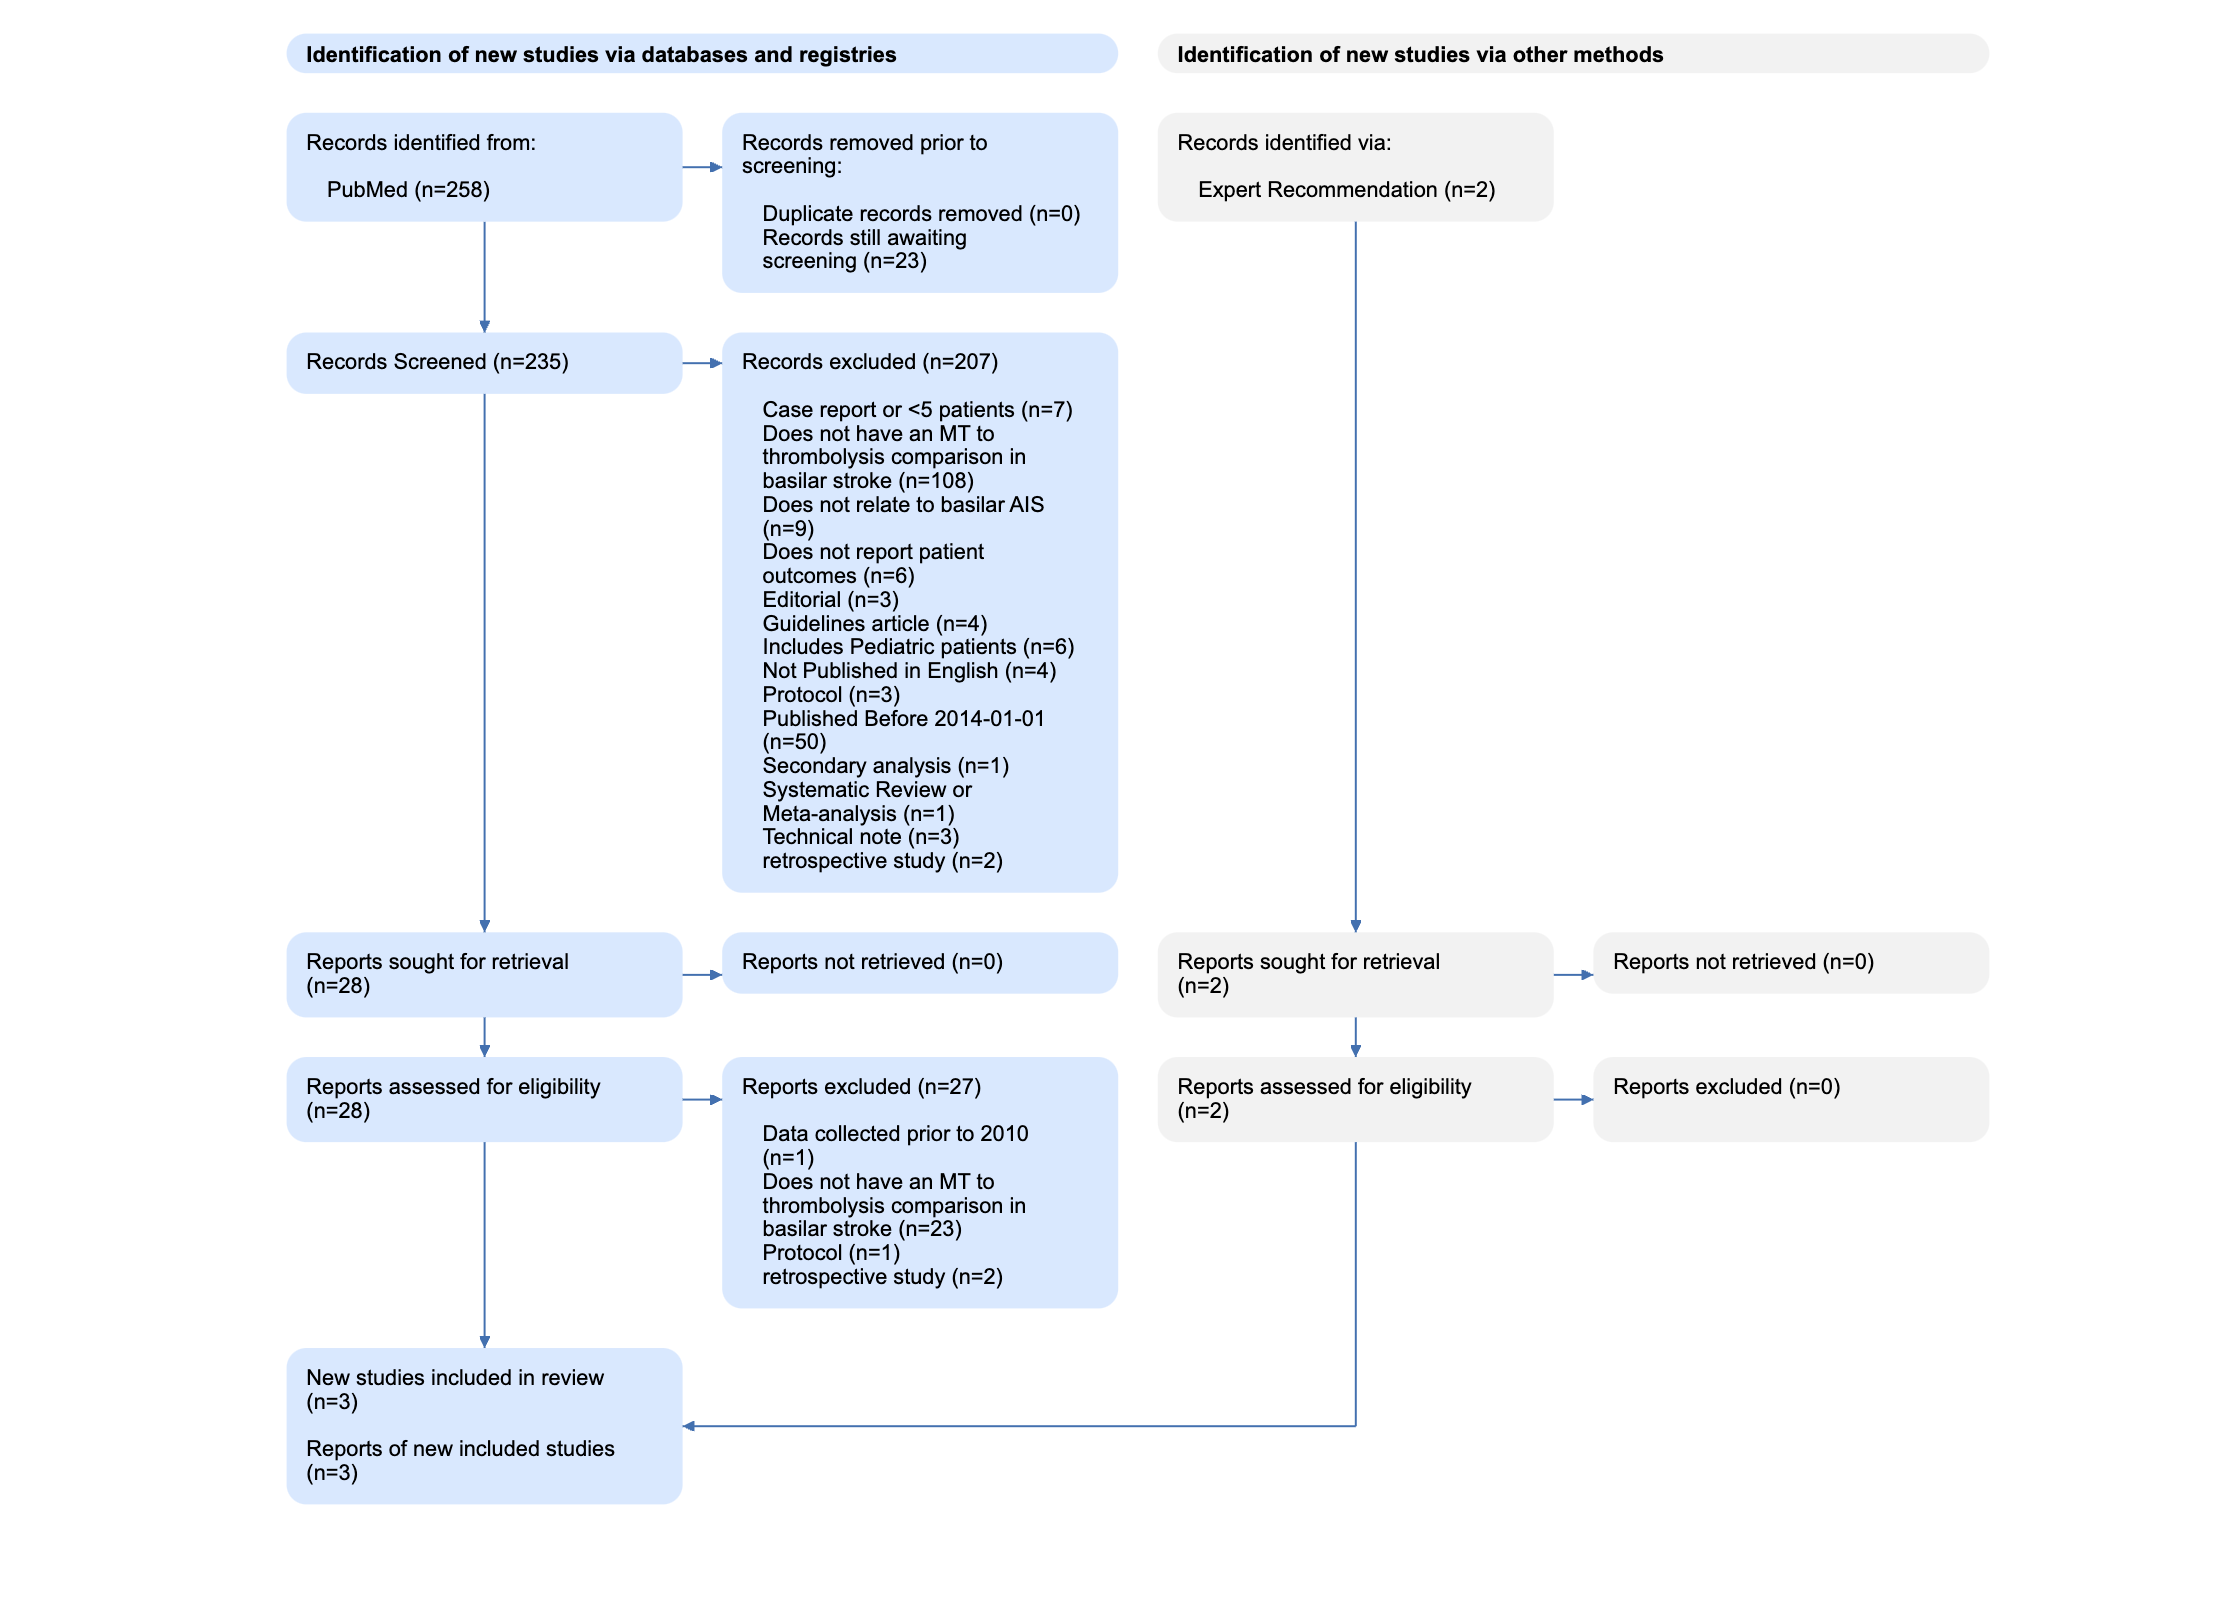
For instance, in this review of Basilar Artery strokes, the authors elected to exclude case reports (n=7) and retrospective studies (n=2) that resulted from their search, as shown in their PRISMA Diagram. They also excluded evidence from 2014 or earlier (n=50), and studies of pediatric stroke (n=6). Each of those reasons has a good explanation (analyzing only high-quality evidence, narrowing in on current practices, avoiding population bias), but a different reviewer may have made different choices. The PRISMA Diagram helps display those choices and their impact on the final set of studies reviewed in that publication.
So, in short, excluded studies may not contain relevant data, but it is extremely important to show why they were excluded, in case any reader or subsequent reviewer wants to examine evidence that was excluded for any of your Exclusion Reasons!
Do I need to use PRISMA if I’m not publishing?
PRISMA Diagrams are required by many journals, but that does not mean they are not useful in other cases! The necessity of including a PRISMA Diagram depends on exactly why you are completing a review, but they are independently useful to:
- Show the criteria you used to separate the ‘wheat’ from the ‘chaff’
- Show the sources of your underlying evidence
- Track / audit your review process and ensure that it matches current practices in systematic review / meta-analysis.
Several non-published review use cases benefit from inclusion of a PRISMA Diagram:
- Reviewing the literature in advance of designing a clinical trial: (as recommended in this published clinical trial planning guide), “Exhaustive bibliographic study is needed to be sure that the question has not already been resolved…If the literature does not indicate that the question has been resolved, it is desirable at this stage, in the light of published works on the same subject, to reconsider its pertinence. If it still seems of interest, then the feasibility of the study must be ensured. A maximum of data must be obtained to understand the most recent developments in the subject, the methodological choices, the problems encountered, etc.”
- As part of Clinical Evaluation Reports submitted to the EU under MDR 2.7.1 Rev 4. As outlined by MedTech Intelligence, “Literature reviews are used to establish and document the State of the Art (SOTA) and available treatment options, establish safety and performance of the device and its claimed equivalents, establish equivalence with similar CE market devices and to gather evidence and clinical data.”
- Health Technology Assessments (HTA) completed to evaluate therapeutic performance. As attested in an international review of HTA organizations, “The [PRISMA] project not only helped to define and reach consensus on a set of indicators on which evidence is required before decisions are taken, but it has also developed a mechanism through which various district-level stakeholders get the opportunity to be part of the decision-making process.”
So, in effect, any analysis based on drawing evidence from the published literature for clinical trial planning, regulatory submissions, or health technology assessment can benefit from the transparency and structure imparted by the PRISMA process. We recommend following PRISMA guidelines and including a PRISMA Diagram in any report of findings in these fields, as well as any other use case where your conclusions depend on extracting evidence from the literature!
How do I read a PRISMA Diagram?
The PRISMA Diagram was set up to show the ‘flow’ of studies from Search through to the set of studies you gathered. You can see a brief overview of the process of reading Nested Knowledge’s automatically-generated PRISMA Diagrams here. Let’s start out with some brief notes and definitions:
Note: Dual “Flows”: Databases & Registries vs. “Other Sources”
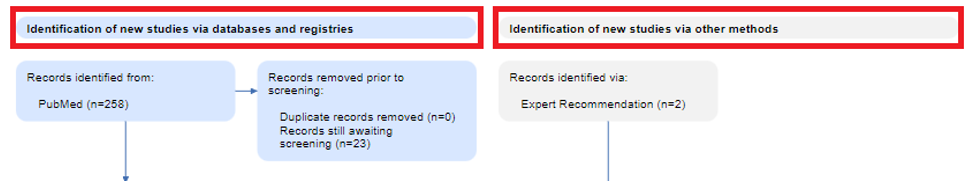
You may notice that PRISMA 2020 has two flows, with “Identification of new studies via databases and registries” on the left and “Identification of new studies via other methods” on the right.
This flow divides out the records you found into those that were from databases (e.g. PubMed) from those that you added via expert recommendation, by ‘bibliomining’ from existing reviews, or any other method.
Confusing Definitions: Records, Reports, and Studies
You may also see a mix of the words “Record,” “Report,” and “Study” in the PRISMA Diagram. Full definitions of these are here, but in effect, they help differentiate between:
- Record: A bibliographic entry representing a publication (containing information like Title, Author, Year, Journal, and Abstract)
- Report: A (paper or electronic) journal publication
- Study: The underlying investigation or trial published in Report(s).
This helps distinguish between the metadata of a publication, the actual full text containing the publication, and the underlying study, which may have been published on in several Reports. With that out of the way, let’s jump into the flow!
PRISMA Steps:
In brief, as shown in the figure below, PRISMA is made up of four steps, starting with (1) Search Records & Duplicates, proceeding through (2) Abstract-level Screening and (3) Full-text Screening, and then (4) the Final Included Studies and Reports.
This figure is from the Basilar Artery review noted above, and shows the real flow used in that review.
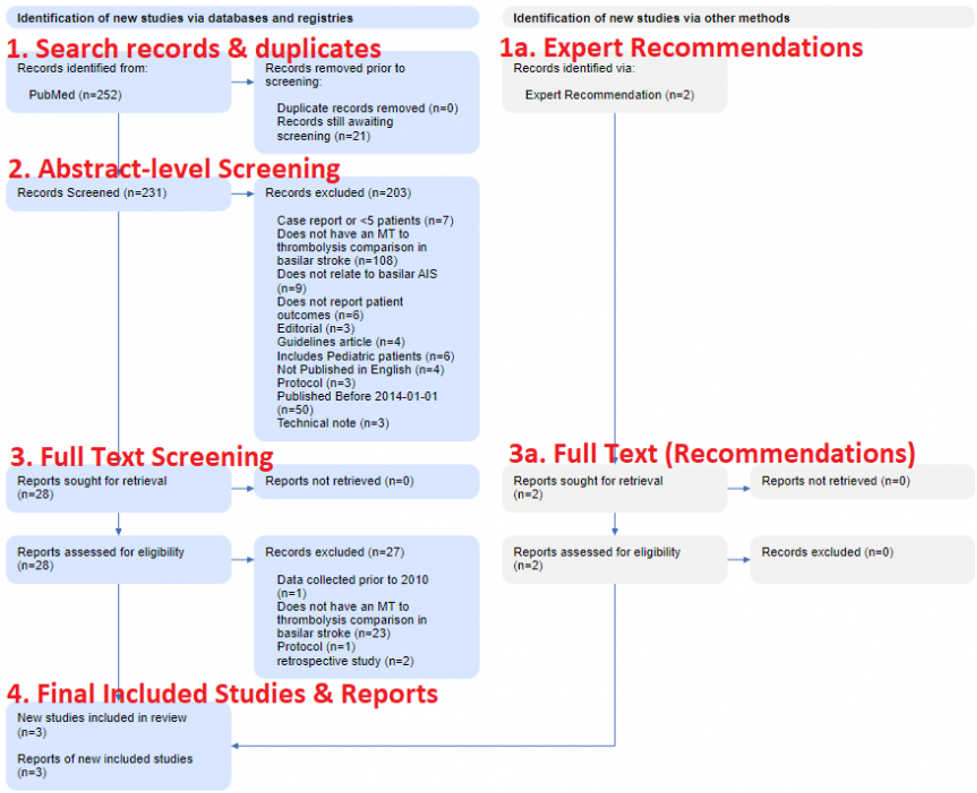
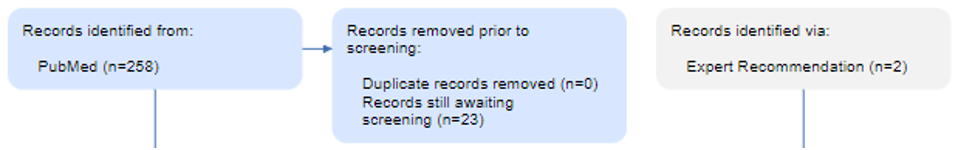
Search Records & Duplicates
The first section (under both Databases & Registries and Other Sources) covers the sources of the Records you reviewed. On the left (in the blue boxes in the image above), all databases are listed with the number of Records from each database. Then, the number of duplicate Records–meaning, any Records with matching bibliographic information–that were removed are noted. In the Basilar Artery review, 252 records were sourced from PubMed, of which none were duplicates.
Nested Knowledge-specific note: Since Nested Knowledge offers ‘living’ reviews with automatically-updating Search, the Duplicates section also notes the number of records that have returned from the search and that are awaiting Screening. In the Basilar Artery review, the automatic search has queued 23 studies for Screening.
On the right, the number of records from Other Sources, such as Expert Recommendations, are noted, and have their own ‘flow’ in the gray boxes. Two Expert Recommendations were noted in the Basilar Artery review shown here.
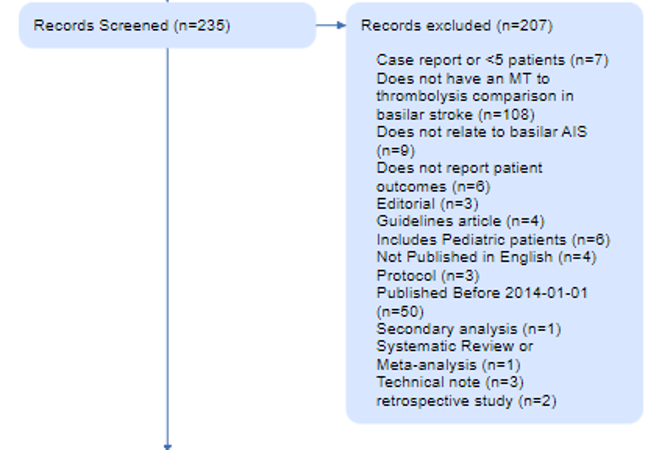
Abstract-level Screening
Any records that proceed forward from the Databases & Registries (as in, those that are not de-duplicated out) are sent forward for Abstract Screening. In this stage, your pre-configured Exclusion Reasons are applied to any record that is irrelevant to your review, and any record that may, based on Abstract review, be relevant is sent forward for Full Text Screening.
The number of records excluded for each reason is noted in the Diagram, to ensure that the potential exclusions that may be of interest to your reader are traced with respect to why they were not in your review. In the Basilar Artery review, 203 studies were excluded for a range of reasons shown here.
As you can see, it is assumed in the PRISMA paradigm that any Other Sources receive full text review, so this step is skipped on the right.
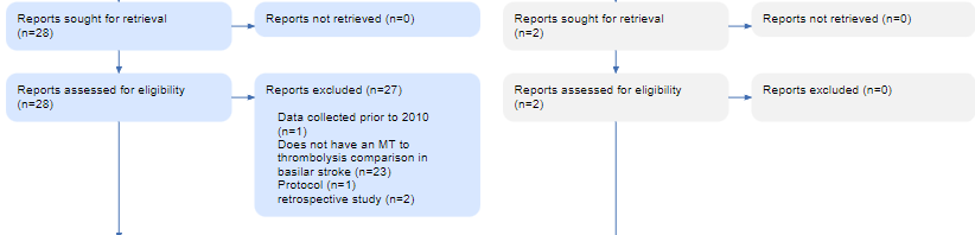
Full Text Screening
Any record that is not excluded at Abstract stage then must have its full text Report retrieved for Full Text Screening. PRISMA thankfully allows for a specialized Exclusion Reason in the case where no full text is available, so the first two boxes in the Full Text section represent the Reports sought and the Reports Not Retrieved. However, for all successfully-retrieved Reports, your bibliographic Record has transformed into a full Report.
This Report is now assessed for eligibility, based on full text review, and any exclusions are noted with the number of Reports excluded for each reason. In the Basilar Artery review, all full texts were available, but the vast majority (n=27) were found to be ineligible.
On the right, any of the Other Sources that were excluded as part of the assessment for eligibility are noted, with the number of Reports excluded for each reason.
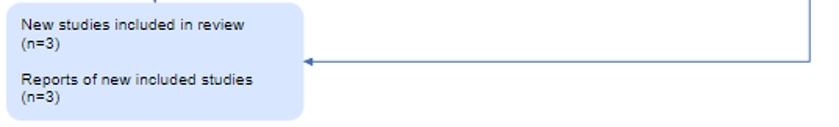
Final Included Studies and Reports
At the end of Full Text Review process (for both Databases & Registries and Other Sources), the total number of Included Reports is consolidated and displayed. This represents the actual publications that you extracted data from, and the Diagram also displays the number of underlying Studies detailed in those Reports. In the Basilar Artery review, despite starting with 254 records, only three Reports (representing three Studies) were included.
This distinction, as noted above, is because you may have extracted data on a single Study (trial or other underlying patient data collection exercise) from multiple Reports. Secondary analyses can contain data not present in the initial published Report of a Study, so the number of Studies vs. number of Reports is also disambiguated in the final box on the diagram.
Summary
Congratulations! You now know:
- Why PRISMA Diagrams are essential to systematic reviews: To reflect the sources, inclusion/exclusion criteria, and flow of records/reports/studies through your screening process;
- Why PRISMA Diagrams reflect both included and excluded records: To show the decision-making process in setting up and executing exclusion;
- When to use a PRISMA Diagram: When publishing a systematic review / meta-analysis, as well as for clinical trial planning, regulatory submissions, and health technology assessment;
- What the ‘jargon’ of PRISMA Diagrams mean: Databases & Registries are differentiated from Other Sources; also, Records are bibliographic, Reports are full text publications, and Studies are underlying trials;
- What each step of the PRISMA Diagram represents: Step 1 shows where your records came from (and de-duplication), Step 2 shows Abstract Screening, Step 3 shows Full Text sourcing and assessment, and Step 4 shows total included Reports and Studies.
If you’re looking for more demonstrations of how reviews work, you can Sign Up for Nested Knowledge’s software for free, and see Demos of nests we built for teaching purposes. Happy reviewing!
Need Additional Assistance?
Email us: support@nested-knowledge.com or click the button below. We’d love to hear from you.