PRISMA Flow Diagram: How publications ‘flow’ through the updated PRISMA 2020 process and chart
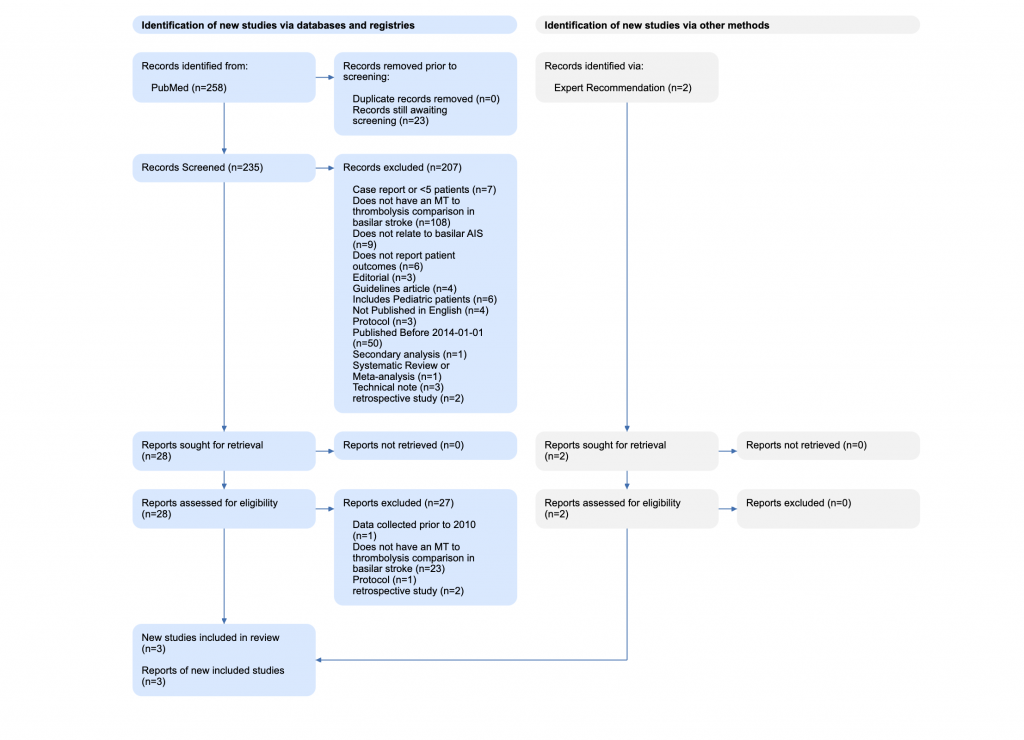
The PRISMA Flow Diagram has become a standard part of any systematic review or meta-analysis, and with good reason– it is the most widely accepted method to show the process by which the studies included in a review were included (or excluded). It also shows the different possible steps of a review, different potential sources (from PubMed to ‘expert recommendations’), and the exact reasons you set up to differentiate the wheat from the chaff among the studies you examined.