June 3, 2022
This help article is about performing data extraction for meta-analyses in the NK Platform. If you just want basic instructions, feel free to check out this part of our wiki.
Meta-Analytical Extraction is quite contentious at NK. It is one of those things you either love or hate with the fire of 1000 suns. I, however, love extraction. As ridiculous as this sounds, I even find it relaxing. There’s nothing like kicking back in my knock-off Herman Miller chair while sipping some fizzy water to extract data, am I right?
Not feeling as excited? Well, hopefully after this post you’ll like it as much as I do. Onwards!
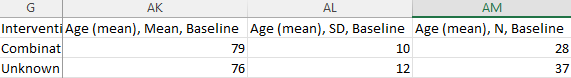
The main goal of MA extraction is to pull data from papers in order to aggregate it in a review. Historically, this was done in an excel spreadsheet. However, at NK, we think there is a better way. We aren’t trying to knock excel; excel is a great tool, but it can become difficult to use when extracting large amounts of data. I mean, who hasn’t accidentally typed in the wrong cell in excel, anyways? That’s why at NK we make MA extraction easy by laying things out in a way that prevent mistakes. Don’t believe me? Take a peek at the side-by-side comparison of the NK extraction module with what the data looks like in excel.
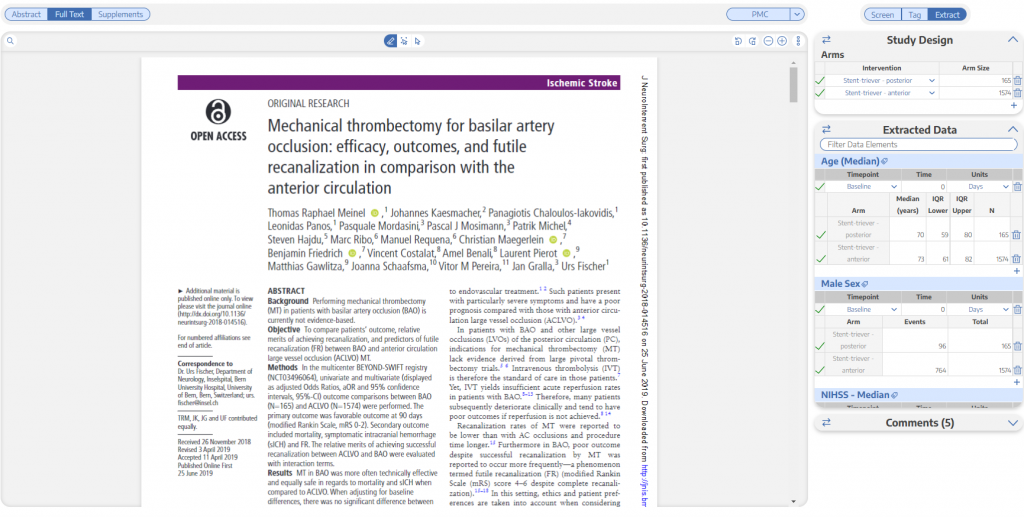
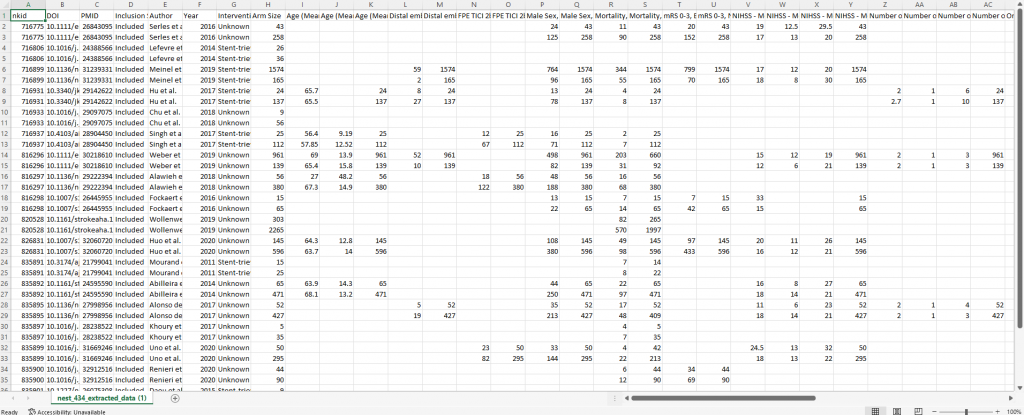
When your spreadsheet goes all the way to column BG, it becomes quite cumbersome to correctly input the data for each study, which is why I’m glad I didn’t have to type in all that data into an Excel spreadsheet. Phew!
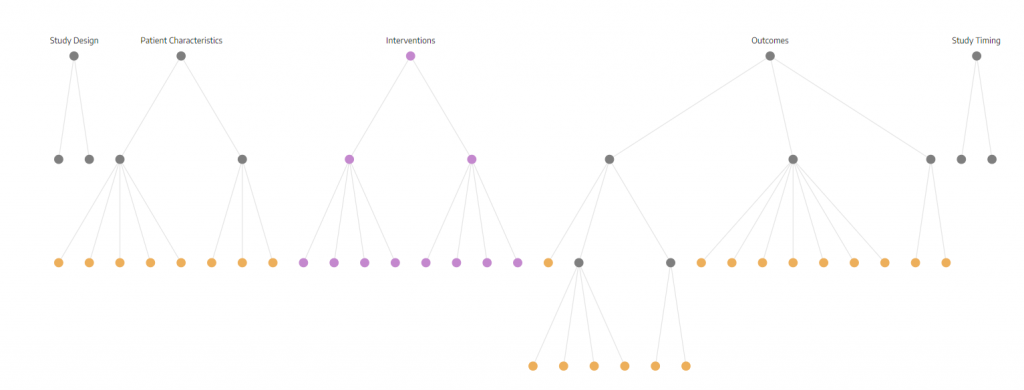
The first step is going to be to configure the hierarchy properly to let the software know which tags you want to turn into data elements. Basically, you want to turn any tag you plan on collecting data for into a data element. Regular tags and data elements are differentiated by color in the software. At NK, a grey node means that it is only a tag and a gold node means that it is a tag and data element. You also might have noticed purple nodes. Hang onto that thought for a second; I’m going to circle back to what purple means.
To turn a tag into a data element all you have to do is click on Extraction Configuration and then on the tag you want. After that, some fields will pop up (shown below) that will need to be answered to correctly configure the data element. For the next part of this blog post, I’m going to go over, in detail, how to answer these questions. However, I know I went really quickly through the steps to get to the fields so feel free to check out these instructions that walk you through the process.
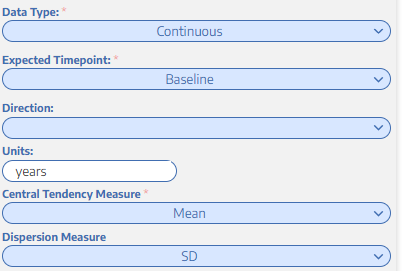
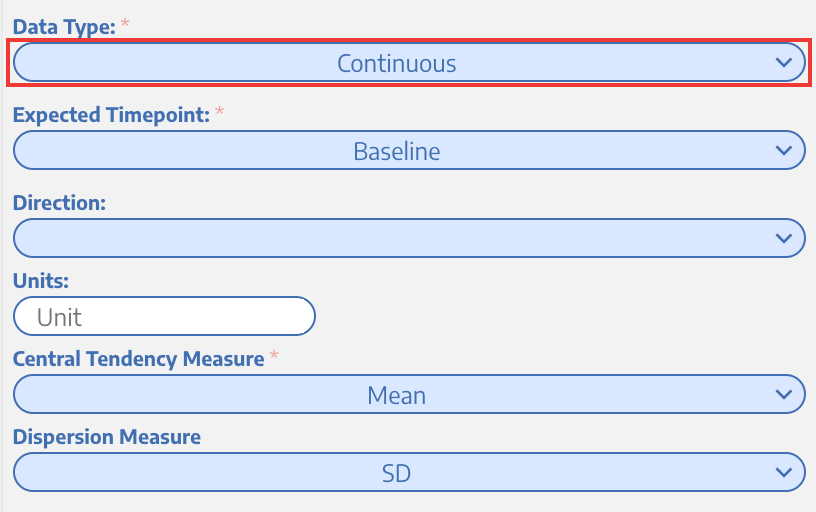
This first question will have three answers for you to choose from. Here are their definitions:
The distinction between dichotomous and categorical is that a dichotomous variable only has two categories. A categorical variable can have many.
Now that you know what this field is asking, select the most appropriate data type for your data element. We did age, a continuous variable, above.
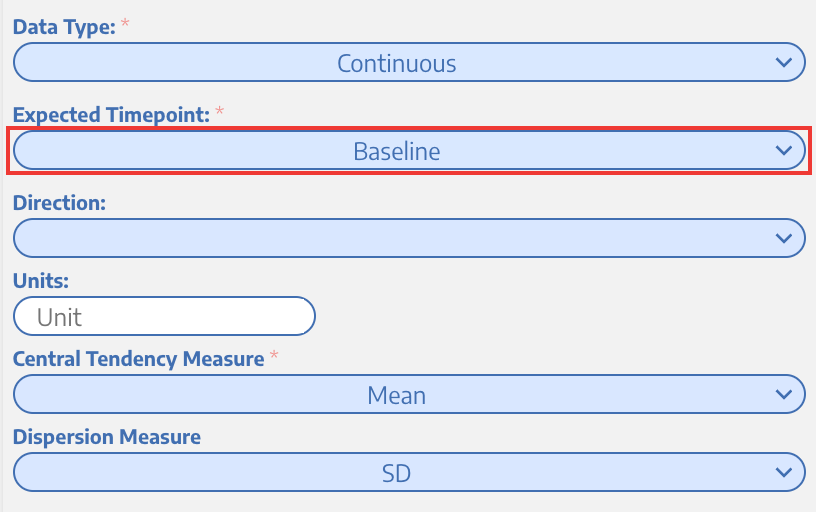
There are two options to choose from:
All this is asking is whether the data element is measured at the baseline (the start of the study) or as an outcome. In this example (and in most cases), age is measured at the baseline.
Regardless of what you answer for the data type, this question will appear. However, the questions you see after expected timepoint will vary depending on the data type selected. Don’t panic! I’ll be going through them all.
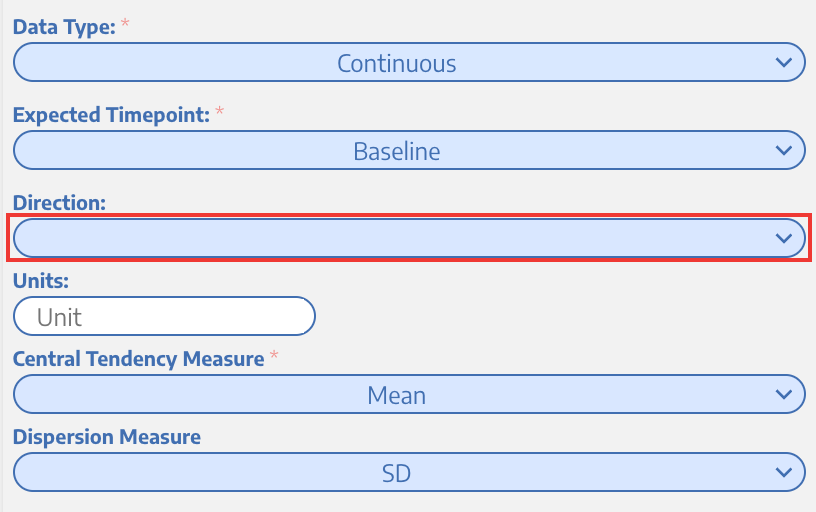
This field will appear for both continuous and dichotomous variables.
There are three options:
Higher better means that the higher the value the better the outcome. For example, if we’re interested in getting blood flow back to the brain after a stroke, if there is a reperfusion metric, the higher that metric, the better. Conversely, for a data element like mortality, lower is better. Blank is used when there is no sense of higher or lower being better. For example, for a data element like age, you might leave direction blank, as we did.
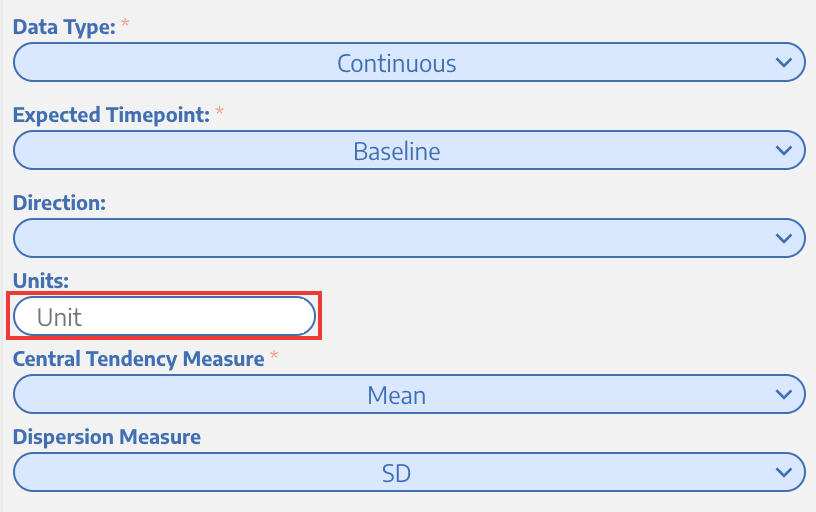
This is exactly what you think it is: the units you’re measuring the data element in. In this example, we’re measuring age in years. However, if we were doing a neonatal study, perhaps days would be more appropriate.
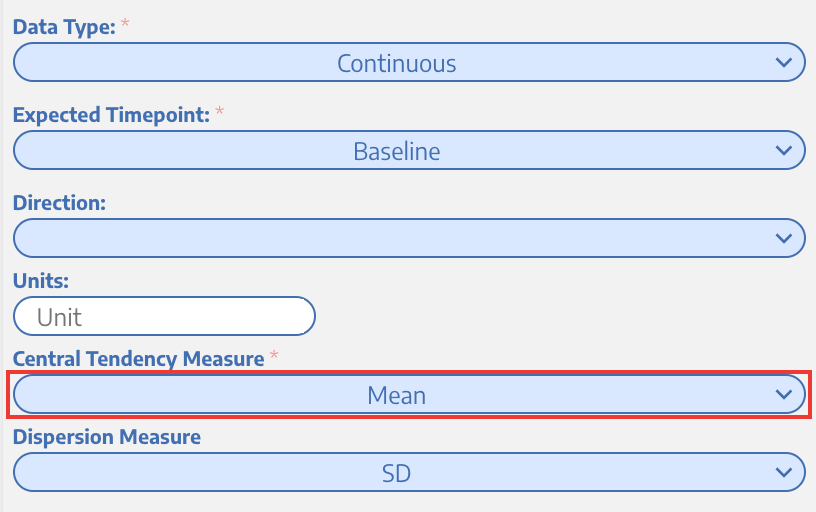
This field will appear only for the continuous variables.
There are two options for this:
This is where things get complicated. How do you choose which central tendency measure to use? You should obviously use the one that’s most commonly reported, but figuring that out is not easy, and frankly, I don’t have a great solution if you haven’t already spent some time going through the studies. The best way I know to figure this out is to have included this information while tagging and then peruse all the tags to figure out which was reported more frequently. If both mean and median were reported equally, then you can create two separate data elements for age (mean age and median age) and then configure them separately.
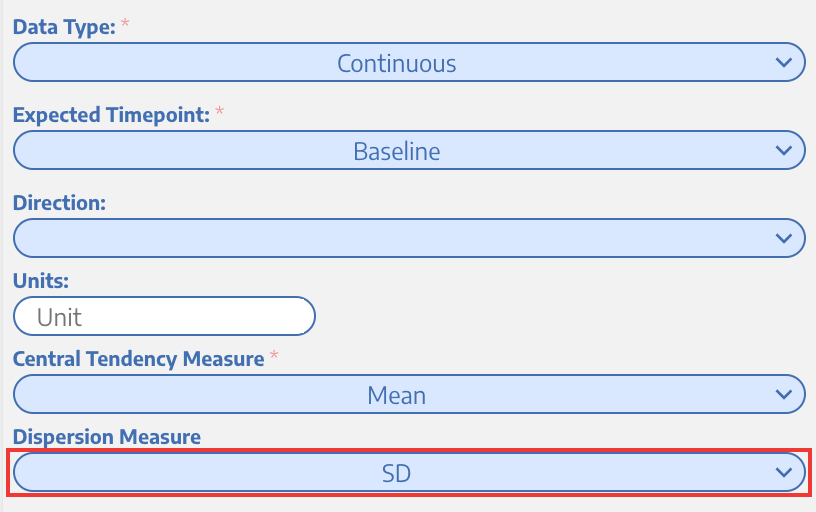
There are three options you can choose from:
Alas, we face the same dilemma we did when choosing between mean and median. The same advice applies here. As someone who has made many a nest, I can assure you that good tagging will make this relatively painless.
And that is a wrap! Those are all the fields that will pop up for you. Once you’ve got all those fields filled out, make sure you hit save and you’ll see that the tag changes color from grey to gold.
Great work! The next step you need to take before diving into actually extracting the data is to configure your intervention hierarchy. What’s that, you ask? Great question! It’s your way of telling the software what the possible arms of all studies are so that you can extract data for every arm in every study. For example, if you’re comparing the efficacy of Drug A and Drug B at treating COVID and a study directly compares those two drugs to placebo, you’d want to be able to extract all three of those arms in that one study. In order to do that, you’d have to configure the intervention hierarchy. To configure the intervention hierarchy, all you have to do is click Extraction Configuration and then click on the root node of the part of your hierarchy that has the tags for your interventions. For more detailed steps on how to configure the intervention hierarchy, check out this part of the wiki.
Still confused? No worries. I think this makes more sense once you start extracting and see what the software is doing.
You’ve finally made it to the finish line of configuration and the start of extraction. Yay! Go ahead and open a study in the MA extraction module.
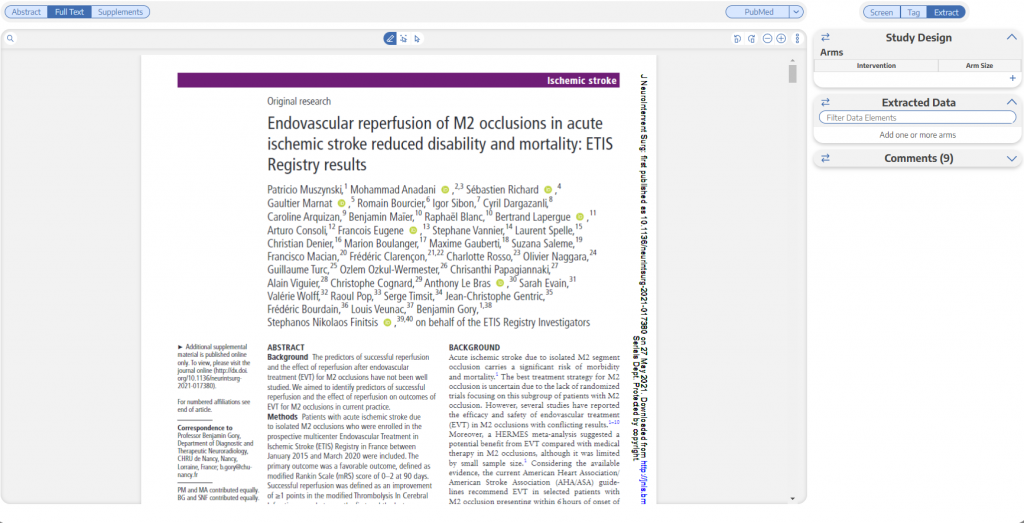
You’re going to see the study, and three boxes on the righthand side: Study Design, Extracted Data, and Comments. You only need to worry about the first two boxes. The comments box is just a place for you to leave a comment on a study or tag someone to review it.
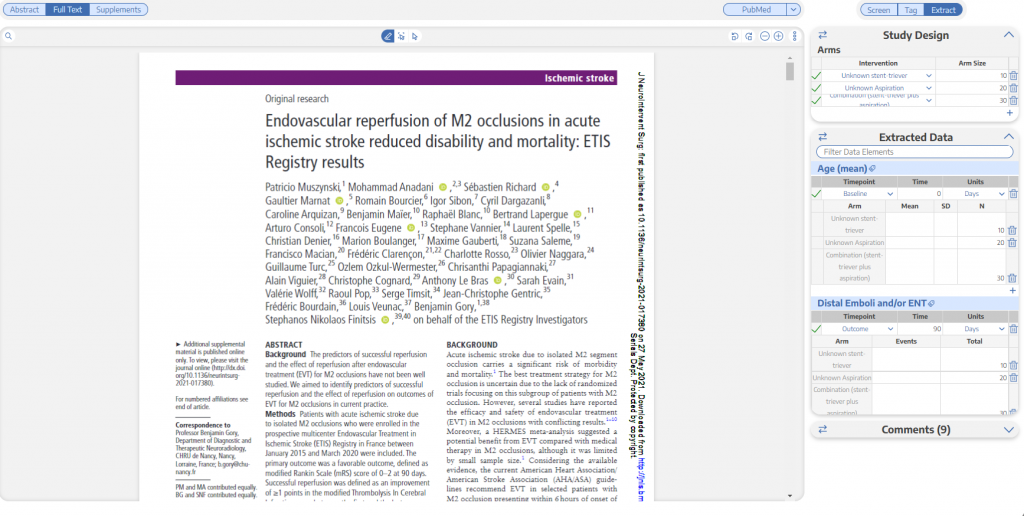
When you click the plus sign, a drop down menu will appear that will list out the interventions. If a study compares Drug A to Drug B to Placebo, then you’ll want to add those three interventions in this box as well as their arms sizes as reported in the study. Doing this will make some cells appear in the Extracted Data section.
How did NK know what interventions to put in the dropdown menu? I can assure you, we’re not mind readers! When you configured the intervention hierarchy and turned those nodes purple, all of the purple nodes then get populated in this drop down menu. To summarize, the nodes you turn purple in the hierarchy become the options for the interventions in the study design box, and the options you select there become the rows for individual data elements so that you can extract all data for all arms of every study.
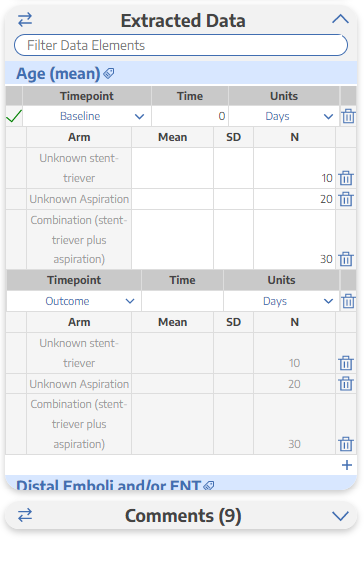
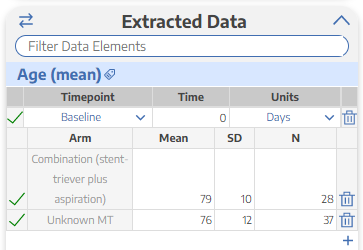
In the example below, Age (mean) is configured as mean/SD. The three rows in that data element correspond to the interventions I put in the study design box, which will allow me to extract the mean age and standard deviation for all three groups in this paper. The same goes for distal emboli and all other data elements. I will be able to extract the number of distal emboli in each group of this study in the events column.
However, before you can start typing in the data, you’ll need to type in the measurement timepoint in the first row. If something is measured at baseline write 0, if something is measured at 24 hours, you can change it to be that too! I anticipate that your next question will be what to do if there are multiple timepoints for the same outcome. NK has an easy solution for that! Click the plus sign at the bottom of the data element and then another timepoint box will appear that you can fill out and then extract the study’s data.
Voilà! You’re done. Now, all you have to do is fill out the cells using the data from the paper. I find this part to be mindless, and I dare say, fun.
You can extract MA data for any number of outcomes from any study at multiple time points with any number of arms in NK software. It’s much less painful than Excel and dual extraction is forthcoming!
No, we don’t offer that (yet). It’s not the easiest task to extract data, even for a human, and there isn’t a way to ensure a high level of accuracy without a human checking the data.
Grey = a regular tag.
Gold = a data element
Purple = a tag that would also be an arm of the study. For example, if a study compares Drug A to Drug B to placebo, you would want to create three tags (Drug A, B, and placebo) to tag that study so that you could filter and find any study with a particular intervention. You’d also want to extract data for each of the arms of the study, which is why you configured it to be purple in your intervention hierarchy.
Think about it this way: would you have started extracting data by throwing it into a spreadsheet with no organization, no column names, etc? No. That’s what these pre-cursor steps are all about: it’s our way of organizing the spreadsheet for you.
Yes! This is a great feature of our software. Check out this wiki page for more information.
Yes! Simply turn it on in admin settings.
Email us: support@nested-knowledge.com or click the button below. We’d love to hear from you.