Blog
How Smart Study Type Tags Are Reinventing Evidence Synthesis
One of the features of Core Smart Tags is Smart Study Type – this refers to our AI system that automatically categorises the study type


A Simple Guide to Understanding AI Screening Models and Cross-Validation in Systematic Literature Reviews (SLRs)
Introduction
AI is increasingly used in systematic literature reviews (SLRs), and screening is one of its most readily AI-assisted steps. Understanding how to evaluate AI performance in this context is crucial for determining its appropriateness in your review. This guide will demystify the process of interpreting key performance metrics for AI screening models used in SLRs.
Background: Cross-Validation and AI Methods and Terms
Let’s get you up to speed on essential concepts:
AI in SLR Screening:
The screening phase of an SLR involves sorting through vast amounts of literature to find relevant studies. AI can help by suggesting or assigning Include and Exclude decisions, and has the potential to make screening faster and potentially more consistent with screening criteria and goals than manual screening alone.
Cross Validation:
Cross validation is a statistical method used to estimate how well a model will perform on new data. Estimating how well a model performs on existing (“training”) data is inadvisable because the model may have learned only from the existing data (“overfitting”) and will overestimate its generalization to new data. In brief, cross validation overcomes this by splitting the existing data into multiple parts, training the model on some parts, and evaluating it on others. Performance estimates are made from latter parts that the model wasn’t trained on.
Features and Labels:
In machine learning, features and labels are fundamental concepts:
Part 1: Data for AI Screening Models
What Data Do AI Screening Models Train On?
First things first, let’s talk data. AI models like NK’s Robot Screener learn to predict screening decisions from features of studies like bibliographic data (such as abstract titles, keywords) and other external data (such as citation metrics). The model learns using decisions made by human reviewers as labels, and it will also use these labels to estimate its performance (cross validation).
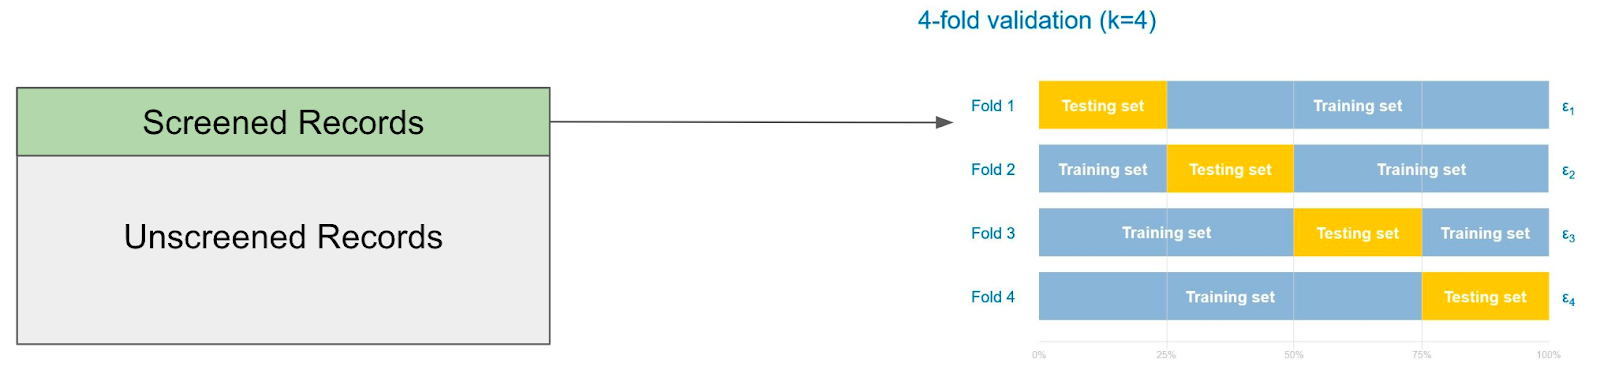
An Example of Cross-Validation
Imagine you have 1,000 records and 200 of them have been screened. Here’s how cross-validation might work in a ‘four-fold’ validation to estimate how the model will perform:
Part 2: Understanding the Confusion Matrix
Before diving into the performance metrics, let’s talk about the confusion matrix. This matrix is a handy tool to visualize how well the AI model is performing compared to human reviewers.
What is a Confusion Matrix?
A confusion matrix is a 2×2 grid that breaks down correct and incorrect predictions; in Cross-Validation, a confusion matrix helps us see the relationship between the AI’s predictions and the actual human decisions. It’s called a “confusion” matrix because it shows us where the model gets confused (makes incorrect predictions), though it can also be a confusing matrix to understand! See below for an explanation that hopefully helps clarify:
|
Label Robot |
Include |
Exclude |
|
Include |
True Includes (TI) |
False Includes (FI) |
|
Exclude |
False Excludes (FE) |
True Excludes (TE) |
Explanation of Terms:
Whenever the human and the robot agree that a paper should be included, we put that decision under True includes (TI) and we tally up one point. We do the same thing when the robot and the human both exclude a record, that decision will be a True Exclude (TE) and we also tally up a point.
Therefore, a way to score the model’s performance is to count every record where the human and robot agree (TI plus TE). The ratio of this count against the total number of records is called Accuracy. Understanding the matrix and its elements is crucial for interpreting the performance metrics we’ll discuss next.
Part 3: Performance Metrics
Now let’s dive into the key metrics used to evaluate the performance of AI models in SLRs: accuracy, recall, precision, and the F1 score, as well as a discussion of the implications and importance of each metric.
Accuracy
What is Accuracy?
Accuracy measures how often the AI’s decisions match the human ones. It’s a straightforward metric that gives a general sense of how often the model is “right”.
Accuracy= (True Includes (TI)+True Excludes (TE)) / Total number of records (N)
Example:
|
(N=100) Label Robot |
Include |
Exclude |
|
Include |
TI = 8 |
FI = 10 |
|
Exclude |
FE = 2 |
TE = 80 |
With 100 records, the accuracy is (8+80)/100 = 0.88.
Why Accuracy Isn’t Everything
But hold up—accuracy isn’t the whole story! Imagine a model that only excludes records; In our previous example, that would yield an accuracy of 90%! It may show high accuracy but would be practically useless. Accuracy doesn’t always reflect a model’s ability to distinguish includes and excludes (most notably in cases of “class imbalance”, which is common in screening) This is why we need to look beyond accuracy to get the full picture.
How do we interpret accuracy in a screening model?
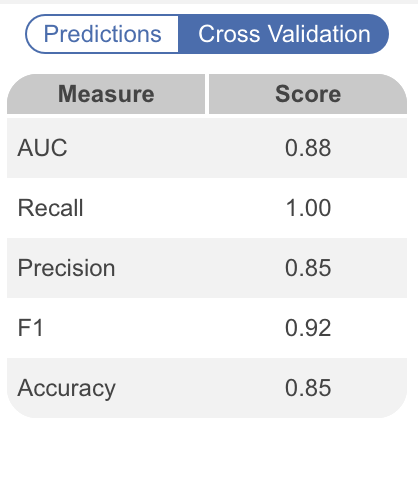
If we look at the Cross-Validation statistics from Robot Screener model above, based on accuracy, the adjudicator and the model will agree in their exclude / include decisions 85% of the time. If you assume the adjudicator and reviewer are approximately equivalent, it means the adjudicator will have to review ~15% of records (and auto-adjudicate the rest, for which the model and reviewer agree).
However, as we saw before, accuracy should not be used as a measure of a model’s performance by itself. When we consider the cost of False Excludes (studies that should have been included but were not) vs. False Includes (studies that require adjudication and will likely be excluded), a False Exclude means that a review entirely misses evidence relevant to its research question. A False Include most typically results in some wasted time when a study is inevitably excluded later in the review. There is a clear intolerance for False Excludes in Systematic Review.
If we consider a False Exclude to be the worst outcome, a statistic such as recall is likely more important than accuracy when thinking about model performance.
Recall
What is Recall?
Recall tells us how well the model identifies records humans include. In other words, recall tells us the proportion of includable/relevant studies the model misses.
Recall= True Includes (TI) / (True Includes (TI)+False Excludes (FE))
Example:
|
(N=100) Label Robot |
Include |
Exclude |
|
Include |
TI = 8 |
FI = 10 |
|
Exclude |
FE = 2 |
TE = 80 |
From the table, recall is 8/(8+2) = 0.80. This indicates that the model is likely missing about 20% of includable studies.
How do we interpret recall?
In the example above, a recall rate of 1.00 (or 100%) suggests that for any record the human would include, the model would also include it (at least within the Cross-Validation set). This suggests that your review may be more comprehensive than if you were using a human reviewer alone, as 100% Recall is a high standard for any model or any expert.
It is important to note that 100% recall rate is an unrealistically high standard, based on the specific screening decisions within the example project. While admirable, perfect performance on any Cross-Validation metric is rare and does not represent that the model cannot make some FEs on future data!
Precision
What is Precision?
Precision measures how often the model’s Include decisions are correct. Where Recall corresponds to review comprehensiveness, Precision corresponds to time savings in adjudication.
|
(N=100) Label Robot |
Include |
Exclude |
|
Include |
TI = 8 |
FI = 10 |
|
Exclude |
FE = 2 |
TE = 80 |
Precision = True Includes (TI) / (True Includes (TI) + False includes (FI))
Example:
If we take our example, we only care about the Model’s Include decisions: for any record where the model chooses to include, how frequently are those decisions correct? Looking at our data, we can see from 18 total include decisions by the model, only 8 of them were agreed upon by the human to include. By doing the ratio, 8 / (8+10) we get a precision of 0.44 (44%). This means that 44% of records that the robot said to include, the human also said to include.
This can be confusing when thinking about it relative to Recall. To illustrate this, you can think of it this way: Recall is the rate at which the model includes records a human would have included. Precision reflects the proportion of the model’s inclusion decisions that are in fact relevant.
Another way to think about Precision in the Dual Screening with Robot Screener context is, “how much extra work will the adjudicator have to do?”. In practical terms, a precision of 44% means that over half of the records that the robot includes will likely require adjudication due to being excluded by the human reviewer.
How to interpret precision?
In this example, the precision is 85%. We can interpret this as 85% of the time that the model includes a record, the adjudicator will also include that record. So all in all, in a project such as this one where the recall rate of the model is 100% and the precision is also very high at 85%, we can conclude that :
Implications of Recall vs Precision
In SLRs, missing relevant studies has an impact on findings—it undermines the comprehensive nature of SLRs on a given topic. At Nested Knowledge, recall is generally recognized to be the most important Cross-Validation statistic, since the outcome of low recall is potentially excluding relevant data (while the implication of higher rates of False Includes is simply more adjudication needed).
Precision is all about reducing the workload of reviewing false includes. Higher precision means less time spent on unnecessary reviews, making the screening process more efficient.
However, if we compare against Recall, where the implication of low Recall is non-comprehensiveness, Precision is comparatively more of an assessment of efficiency than final accuracy, so long as all Include recommendations are adjudicated.
In effect, Recall is the single best statistic for ensuring comprehensiveness, making high recall a vital trait of AI Screening assistants.
F1 Score
What is the F1 Score?
The F1 score balances precision and recall, giving us a single metric that captures both aspects of the model’s performance. It is the harmonic mean of precision and recall.
F1 Score=2 × (Precision x Recall) / (Precision + Recall)
Why the F1 Score is Useful
The F1 score is particularly useful when we need a single measure that considers both false includes and false excludes. It helps us understand the trade-off between precision and recall (in effect, balancing comprehensiveness against relevancy and efficiency).
Part 4: Comparing AI Performance to Human Screening
How does AI stack up against humans, and how much work can it save? To answer this question, in an Internal Validation study published at ISPOR 2024 reviewing 100,000 decisions over 19 SLR’s with robot screener turned on, we looked at metrics like recall and precision to make a rough comparison against human accuracy.
Human vs. Robot Performance
Another External Validation study published at ISPOR 2024 by Cichewicz et al., showed similar results in 15 SLRs covering different topics and review types in Health Economics and Outcomes Research. Note that in the External Validation, there was no statistical difference in the Recall of Robots and Humans, though Humans had significantly higher Precision.
The high Recall from these validations means that when using Robot Screener, you can expect to miss very few includable records, but lower precision means more work adjudicating false includes. In effect, the model prioritizes comprehensiveness, while humans outperform in assessing relevancy and reducing adjudication time. The increased workload in terms of adjudicating false positives is mitigated by the fact that, in a Dual Screening process, the AI itself reduces the reviewer screening time by 50% and the total time (including adjudication) by ~45%.
What threshold should each metric reach?
There is no universally established threshold that a model must reach in order to be employed. It is far better to understand the implications of each statistic (e.g. a Recall of 0.80 indicates that 80% of relevant articles will be included by the model) than to trust in simple threshold recommendations.
Nested Knowledge’s team’s heuristics for Cross Validation are: High AUC (.8+) indicates that your model is effectively discerning between abstract advanced and excluded records. High Recall (70%+) indicates that the model will less frequently exclude relevant records. If recall drops too low, it is recommended to perform more screening (particularly generating more inclusions or advancements) before using the model’s predictions. This will provide more training examples to improve its performance on abstract advanced records.
For employing Robot Screener, Nested Knowledge has established a general threshold based on testing the model across many different SLRs. The minimum requirement to 10 abstract advanced records and 50 abstract screened is to ensure that AI decisions have minimally sufficient data in most cases; however, this is not to say that 50 records is always enough! Since accuracy varies across SLRs, establishing your own ‘rules of thumb’ as to what represents acceptable accuracy, Recall, AUC, or other metrics will make for better collaboration with the AI model in your project.
Conclusion
By leveraging AI in the screening process of SLRs, we can significantly reduce the time and effort required, ensuring that the reviews are thorough and comprehensive. Understanding and applying these performance metrics will help you effectively integrate AI into your SLR workflow, making the process more efficient and reliable.
When it comes to SLRs, recall is key because it ensures we’re not missing any crucial studies. Precision is also important to minimize extra work.
One of the features of Core Smart Tags is Smart Study Type – this refers to our AI system that automatically categorises the study type