Blog
Introducing Core Smart Tags
Introducing Core Smart Tags If you are familiar with Tagging in Nested Knowledge, you know how integral the process of setting up a tagging hierarchy
One of the features of Core Smart Tags is Smart Study Type – this refers to our AI system that automatically categorises the study type (design) of a given abstract. Knowing the study type is beneficial for a variety of reasons; most importantly filtering out studies that do not match the SLR protocol (which quite often have specific included or excluded study types).
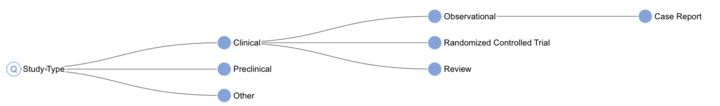
The previous SST, while effective, had limitations with respect to its accuracy and the range of labels it could generate; as you will see in figure 1, our available taxonomy was somewhat limited.
In this new iteration of SST, we’ve significantly expanded the range of possible classifications by introducing a hierarchical label structure. We’ve also improved both model accuracy and interpretability. In addition to providing a classification, the system now highlights segments of text considered most relevant to the decision.
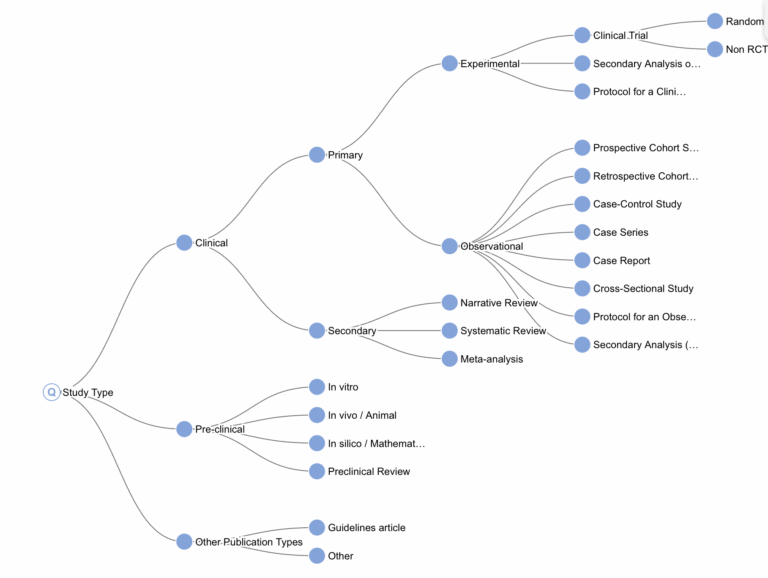
As shown in Figure 2, we have defined our own study type taxonomy. While several existing classification systems exist (such as MeSH’s Study Characteristics & Publication Type), we created our own for two main reasons. First, PubMed’s labels are often inaccurate – they matched ours in only 65% of cases. Second, although MeSH’s system is suitable for general publication classification, it lacks the specificity needed for systematic literature reviews . Our custom taxonomy lets us group concepts more meaningfully for systematic reviews – for example, clustering all secondary study types or distinguishing pre-clinical from clinical studies, even when the difference lies more in subject matter than in study protocol.
Of course, defining a taxonomy is only the first step. Once we’ve established the desired classification structure, the next challenge is building a tool that can reliably assign those classifications.
Machine learning is a branch of AI that uses large volumes of labeled data to train models capable of predicting the label for previously unseen inputs. In our case, the label is the study type, and the input is the study’s abstract and title.
It’s worth briefly explaining why we don’t rely on large language models (LLMs) to predict study type in real time:
Given these limitations, we opted to train a conventional ML model – but first, we needed training data. So how do you get tens of thousands of labeled abstracts?
Ironically, we solved this using an LLM – just not in real time. By running a single, large batch of predictions on publicly available PubMed abstracts, we sidestepped the issues above. The cost was minimal (about $40), the job took around four hours, and we only used public data.
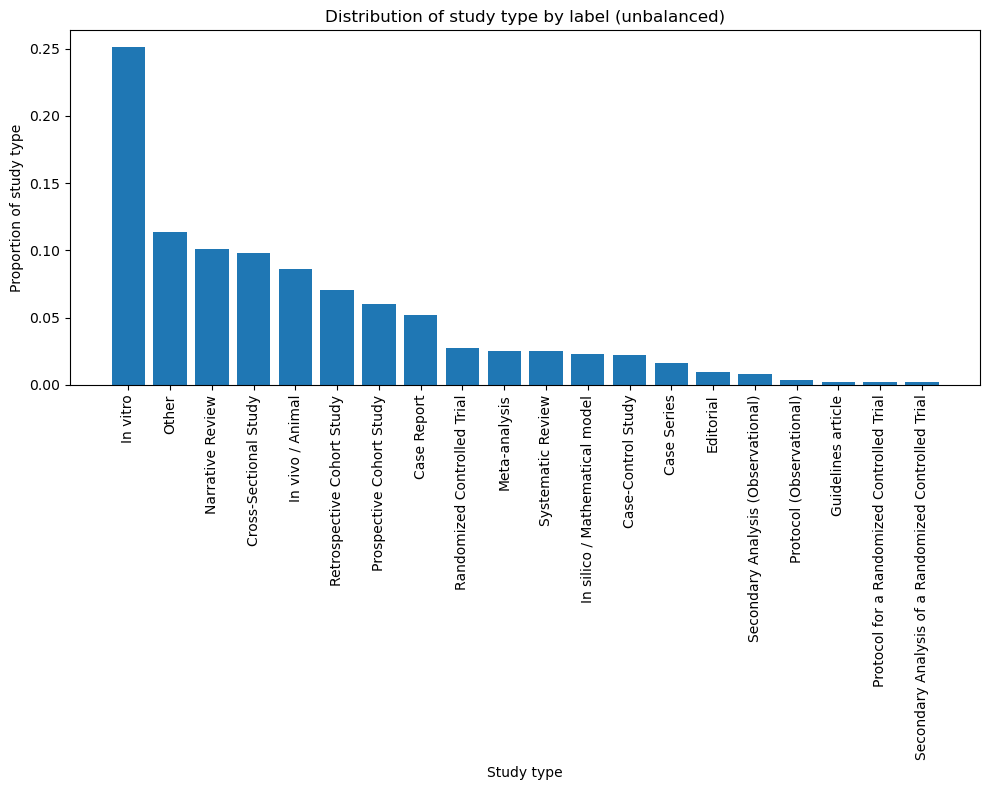
This yielded approximately 40,000 labeled examples. However, we couldn’t just pull a random sample and expect strong performance. PubMed is not a balanced dataset – in-vitro studies outnumber every other type by at least a factor of 2.. As shown in Figure 3, this results in a skewed distribution.
To correct for this, we crafted targeted PubMed queries to enrich for underrepresented categories.
For example, to isolate narrative reviews, we used:
“review”[Publication Type] NOT “systematic”[Title/Abstract] NOT “meta-analysis”[Title/Abstract]
We applied this method across all major study types in our classification taxonomy, carefully refining each query to maximize both precision and recall.
As shown in Figure 4, the final dataset still isn’t perfectly balanced—but it’s a major improvement over the initial distribution.

Once we had the labeled data, the next step was to build the model. We used a Transformer model – not the kind that turns into a car, but the neural network architecture widely used in natural language processing (NLP).
Transformers are common in NLP tasks. If you’ve used predictive text, you’ve already interacted with a simple version of this concept – it predicts the next word based on the previous context. Our model works similarly, but instead of predicting the next word, it predicts the study type based on an abstract.
Technical Notes (feel free to skip):
Under the hood, the system makes five hierarchical predictions:
This layered structure helps the model capture the nuances of our custom study type taxonomy by encoding into the model the covariance implied by hierarchical labels.
The core of the model is PubMedBERT, a language model trained on biomedical literature. We use it as an embedder: it transforms the abstract into a dense vector that captures its meaning. On top of this, we’ve added four classification heads – one for each level of the hierarchy – each trained to predict its respective label.
We trained the model for five epochs- meaning it saw each training example five times. After some light hyperparameter tuning, the model was ready for validation.
Evaluating a model’s performance requires testing it on data it hasn’t seen before. Machine learning models can often “memorize” training data – just like a student who aces a test by memorizing answers without understanding the material. To truly test generalization, we built a separate validation dataset.
This set was curated by our research team, who deliberately selected complex, hard-to-categorize abstracts from various sources (bibliomining internal and published reviews, statistical data sets). After manually labeling & QAing each record – a process that was often lengthy and occasionally ambiguous – we ended up with 300 unseen papers spanning the full range of our study type taxonomy.
We ran the model against this dataset and calculated standard performance metrics. In case you’re unfamiliar with the terminology:
| precision | recall | f1-score |
clinical trial | 0.93 | 0.93 | 0.93 |
experimental | 0.82 | 0.96 | 0.89 |
observational | 0.98 | 0.99 | 0.99 |
other | 0.92 | 0.61 | 0.73 |
pre-clinical | 1.00 | 0.79 | 0.88 |
secondary | 0.90 | 0.94 | 0.92 |
accuracy |
|
| 0.93 |
macro avg | 0.92 | 0.87 | 0.89 |
weighted avg | 0.94 | 0.93 | 0.93 |
Table 1: Performance metrics for level 3.
At Level 3 (the third tier of our taxonomy), the model performs strongly across nearly all study types, with an average F1-score of 0.93. The only label scoring below 0.79 was the catch-all “Other” category – an intentionally broad class.
This validates the model’s ability to distinguish between major study types with a high degree of accuracy. However, as expected, performance declines at Level 4, where classifications are more specific and granular.
High-performing classes
Low-performing classes
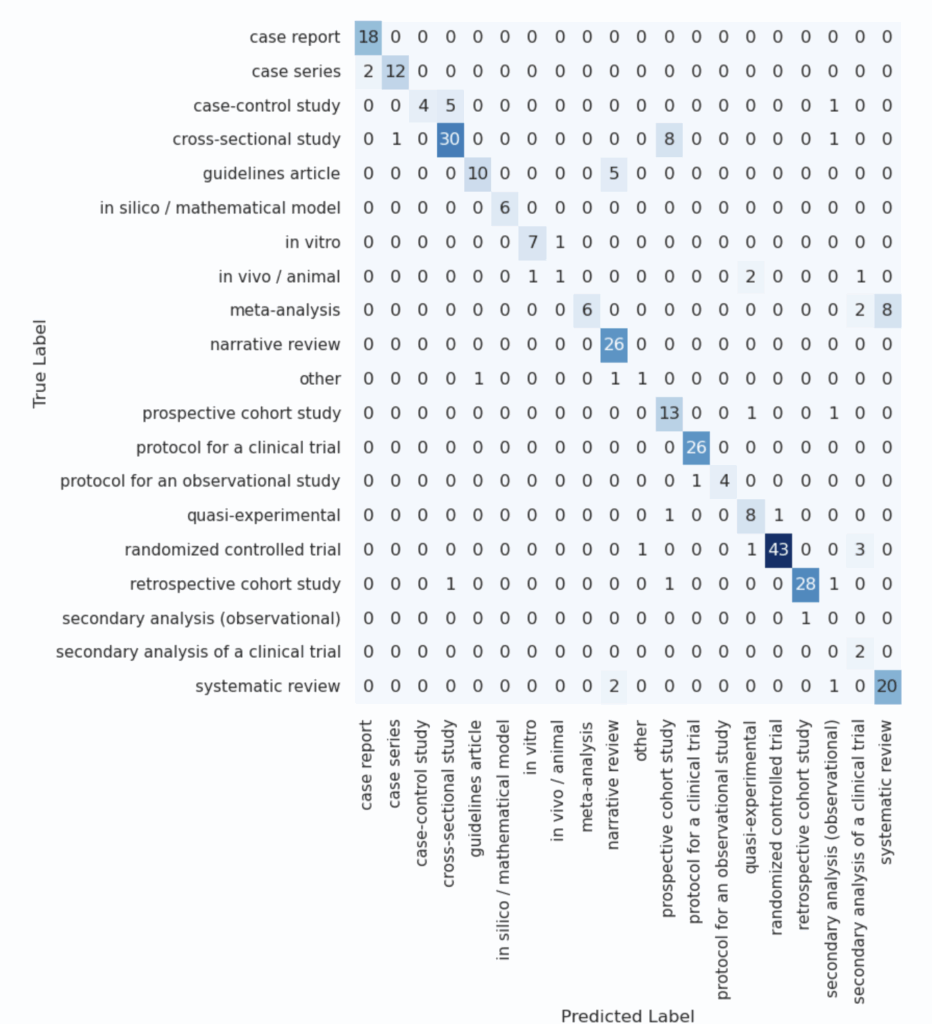
At first glance, these mixed results might seem concerning – particularly the low score for meta-analyses, which are highly relevant in systematic reviews. To better understand these issues, we analyzed a confusion matrix that reveals which classes were frequently mistaken for one another.
| precision | recall | f1-score |
case report | 0.90 | 1.00 | 0.95 |
case series | 0.92 | 0.86 | 0.89 |
case-control study | 1.00 | 0.40 | 0.57 |
cross-sectional study | 0.83 | 0.75 | 0.79 |
guidelines article | 0.91 | 0.67 | 0.77 |
in silico / mathematical model | 1.00 | 1.00 | 1.00 |
in vitro | 0.88 | 0.88 | 0.88 |
in vivo / animal | 0.50 | 0.20 | 0.29 |
meta-analysis | 1.00 | 0.38 | 0.55 |
narrative review | 0.76 | 1.00 | 0.87 |
other | 0.50 | 0.33 | 0.40 |
prospective cohort study | 0.57 | 0.87 | 0.68 |
protocol for a clinical trial | 0.96 | 1.00 | 0.98 |
protocol for an observational study | 1.00 | 0.80 | 0.89 |
quasi-experimental | 0.67 | 0.80 | 0.73 |
randomized controlled trial | 0.98 | 0.90 | 0.93 |
retrospective cohort study | 0.97 | 0.90 | 0.93 |
secondary analysis (observational) | 0.00 | 0.00 | 0.00 |
secondary analysis of a clinical trial | 0.25 | 1.00 | 0.40 |
systematic review | 0.71 | 0.87 | 0.78 |
accuracy |
|
| 0.82 |
macro avg | 0.77 | 0.73 | 0.71 |
weighted avg | 0.86 | 0.82 | 0.82 |
Table 2: Performance metrics for level 4
This analysis gave critical context. For example:
To illustrate this final point, we asked ChatGPT to generate a simple comparison between cross-sectional and prospective cohort studies. The eagle-eyed viewer may detect the issue:
Cross-Sectional | Prospective | |
Observational? | Yes | Yes |
Involves a cohort or group of people? | Yes | Yes |
Can use surveys, questionnaires, or medical tests? | Yes | Yes |
Talks about exposure and outcome? | Yes | Yes |
Can look descriptive in the abstract? | Yes | Yes |
Table 3: Difference between prospective and cross-sectional studies
In essence, the key differentiator between these two study types is when data is collected (at one point in time vs. over time) – a detail that’s often omitted from abstracts. This highlights one of the core challenges in automatic classification: when critical information isn’t present in the input, even sophisticated models will struggle.
Critically, these miscategorizations are correctable. For example, a researcher targeting meta-analyses for inclusion should probably look at both SRs and MAs as tagged by CSTs, or zoom out entirely to the Secondary study type (which is quite reliable at 95% accuracy).
One of the major new features in SST is a focus on interpretability. In addition to providing the predicted study type, the system also highlights text fragments from the abstract that were most influential in the model’s decision.
These highlighted segments – what we refer to as annotations – help end users understand why the model reached its conclusion.
Technical note: These annotations are derived from attention weights within the transformer architecture. Specifically, we identify the sentence with the highest cumulative attention score as the most ‘important’ for classification.
Study Type | Example annotation |
Case Report | A Chinese pediatric patient with thalassemia traits and compound heterozygous mutations in the piezo1 gene suspected of having dehydrated hereditary stomatocytosis. |
Case Series | Minimally invasive stabilization of the anterior pelvic ring in fragility fractures using a submuscularly implanted internal fixator – a retrospective case series of 34 geriatric patients. |
Case-Control Study | Methods a nested case – control study was conducted among a retrospective cohort of young workers in the bakery, pastry-making and hairdressing industries. |
Cross-Sectional Study | Network analysis of interpersonal conflict, emotional exhaustion and psychological distress among mental health nurses in the workplace: a cross-sectional survey. |
Guidelines article | Multidisciplinary concussion management recommendations. |
In silico / Mathematical model | Projected effects of proposed cuts in federal medicaid expenditures on medicaid enrollment, uninsurance, health care, and health . |
In vitro | Viral isolation and culture from the field-collected ticks. |
In vivo / Animal | Direct comparison of the effects of first- and second-generation h(1) -receptor blockers on motor functions in mice. |
Meta-Analysis | The effects of physical activity on sleep: a meta-analytic review. |
Narrative Review | Bibliometric review and perspectives on the biological activity of polyoxometalates against resistant bacterial strains. |
Other | Accelerating animal replacement: how universities can lead – results of a one-day expert workshop in Zurich, Switzerland. |
Prospective Cohort Study | If the patient’s history was suspect for asthma, a provocative concentration causing a 20 % decrease in forced expiratory volume in 1 second (pc(20)) histamine challenge followed. |
Protocol for a Clinical Trial | Registered 22 diabetes telemedicine mediterranean diet (diatelemed) study study protocol for a fully remote randomized clinical trial evaluating personalized dietary management in individuals with type 2 diabetes. |
Protocol for an Observational Study | Exploring the role of microbiome in susceptibility, treatment response and outcome among tuberculosis patients from Pakistan: study protocol for a prospective cohort study (micro-stop). |
Quasi-Experimental | Materials and methods: twenty-five patients with psoriasis and metabolic syndrome were enrolled in a 52-week prospective study. |
Randomized Controlled Trial | Effects of asymmetric nasal high-flow cannula on carbon dioxide in hypercapnic patients: a randomised crossover physiological pilot study. |
Retrospective Cohort Study | Methods: this was a retrospective study in which all samples with hb-f>5% and / or hb-a(2)>3. |
Secondary Analysis (Observational) | In expanded genome-wide association analyses of own birth weight (n=321, 223) and offspring birth weight (n=230, 069 mothers) , we identified 190 independent association signals (129 of which are novel). |
Secondary Analysis of a Clinical Trial | We did an additional analysis in the canakinumab anti-inflammatory thrombosis outcomes study (cantos), a randomised trial of the role of interleukin-1β inhibition in atherosclerosis, with the aim of establishing whether Inhibition of a major product of the nod-like receptor protein 3 (nlrp3) inflammasome with canakinumab might alter cancer incidence. |
Systematic Review | Tardive dyskinesia with antipsychotic medication in children and adolescents: a systematic literature review. |
Table 4: Example annotations by study type.
Examining these annotations reveals some encouraging and intuitive behavior:
Of course, interpretability is not always perfect. In some misclassified examples, the annotation highlights sentences that mislead the model -often because the abstract mentions the label of a different (but related) study. For example:
These cases illustrate both the power and the limits of attribution. While the system often surfaces genuinely helpful and intuitive signals, it’s important not to over-interpret individual examples – especially in cases where the classification is incorrect.
That said, we believe the overall performance and potential utility of this feature more than justify its inclusion. It adds a valuable layer of transparency that supports human validation and builds trust in automated decisions.
In this post, we’ve introduced our new Smart Study Type system – part of the broader Smart Tags initiative. We’ve explained how it was built using a custom study taxonomy, how the model was trained and evaluated, and how it performs across a wide range of study types.
We also showcased our focus on interpretability, highlighting how the system offers transparent justifications for its predictions and what that means for end users.
While there are still challenges in the most granular labels, the results so far are promising – and we’re excited about how this tool can enhance the systematic review process by providing fast, accurate, and interpretable study type classifications at scale.
Yep, you read that right. We started making software for conducting systematic reviews because we like doing systematic reviews. And we bet you do too.
If you do, check out this featured post and come back often! We post all the time about best practices, new software features, and upcoming collaborations (that you can join!).
Better yet, subscribe to our blog, and get each new post straight to your inbox.
Introducing Core Smart Tags If you are familiar with Tagging in Nested Knowledge, you know how integral the process of setting up a tagging hierarchy